An SAT Math micro-topic under Exponential graphs (Advanced Math). Free to read — no account needed.
An asymptote is a straight line that a graph approaches more and more closely without ever touching it. Exponential graphs have a horizontal asymptote because of how they behave at the ends: at one end y grows or shrinks without bound, and at the other end the curve flattens, settling towards a fixed value it never quite reaches.
For an exponential written as y=a⋅bx+k, that fixed value is the constant k. As the a⋅bx part shrinks towards 0, the whole expression approaches k. So the horizontal asymptote is the line y=k, read directly from the number added at the end.
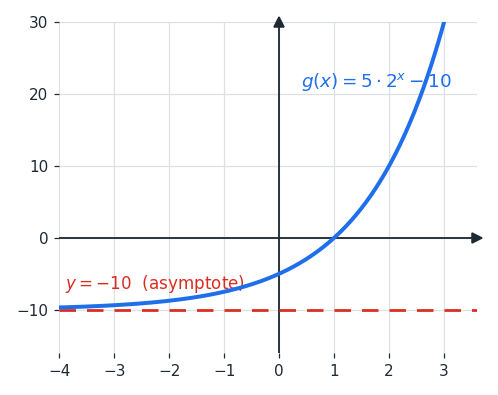
This makes a class of questions quick: in g(x)=5⋅2x−10 the asymptote is y=−10; and if you are told the asymptote of y=2⋅bx+c is y=−5, then c=−5.
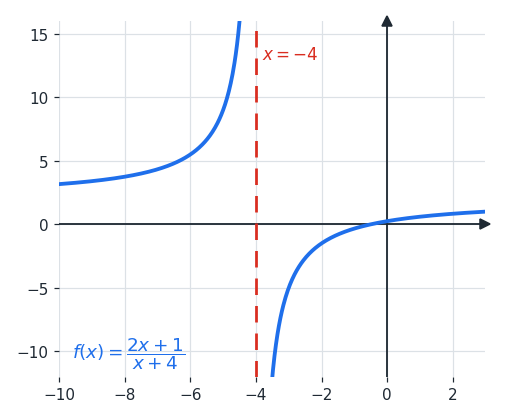
Rational functions have asymptotes too, but of a different kind. A vertical asymptote occurs at any x where the denominator equals zero while the numerator does not, because the function is undefined there. For example f(x)=x+42x+1 is undefined at x=−4, so x=−4 is a vertical asymptote.
Worked examples
Find the horizontal asymptote of g(x)=3⋅4x−6. It has the form a⋅bx+k with k=−6. As 4x→0, g(x)→−6, so the horizontal asymptote is y=−6.
The graph of y=3⋅bx+c has a horizontal asymptote at y=2. The asymptote equals the constant added on. So c=2.
Find the vertical asymptote of f(x)=x−5x−3. Set the denominator to zero: x−5=0. So x=5 is the vertical asymptote.
Is this one of the topics costing you points?
Take the free 10-question diagnostic for a predicted SAT score and a breakdown of which domains are costing you points.