Basic causality and correlation
An SAT Math micro-topic under Evaluating statistical claims (Problem solving and data analysis). Free to read — no account needed.
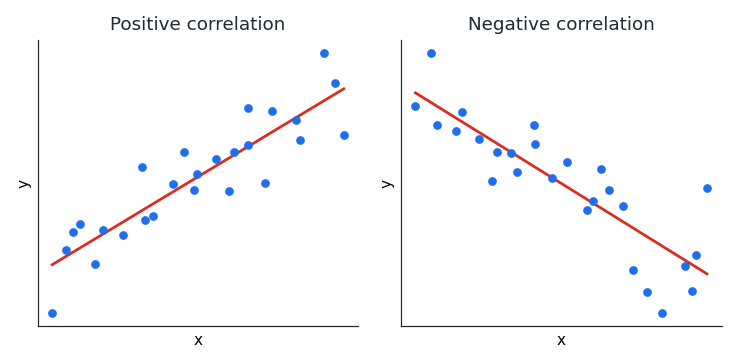
Two quantities are correlated when they tend to move together in a predictable way. If they rise and fall together the correlation is positive; if one rises while the other falls it is negative. The scatterplots below show both: a rising cloud of points on the left and a falling cloud on the right, with the red line summarising the overall trend.
Causation is a much stronger statement: that changing one quantity actually produces the change in the other. The key SAT trap is that correlation does not prove causation. If and rise together, it might be that drives , that drives , or that a third, outside variable drives both.
To establish causation you need a controlled experiment with random assignment, where subjects are randomly placed into groups so that outside factors are evened out. An observational study or a survey, however large, can only reveal correlation, never causation.
Worked examples
A survey finds that students who eat breakfast tend to score higher on tests. Can we conclude breakfast causes higher scores? No. A survey is observational, so it can only show a correlation. Higher-scoring students might simply have more organised routines that happen to include breakfast, or some other factor could drive both.
In a study, participants are randomly assigned either to meditate or not, and the meditators later show better focus. Here we can conclude causation, because the random assignment evens out other factors, so the meditation is what produced the improvement. The phrase randomly assigned is the signal that causation can be claimed.
Is this one of the topics costing you points?
Take the free 10-question diagnostic for a predicted SAT score and a breakdown of which domains are costing you points.