Comparing standard deviation between 2 groups
An SAT micro-topic explainer. Free to read — no account needed.
Standard deviation is a measure of spread: how far the values in a data set sit from their average. Values bunched close together have a low standard deviation; values scattered far apart have a high one.
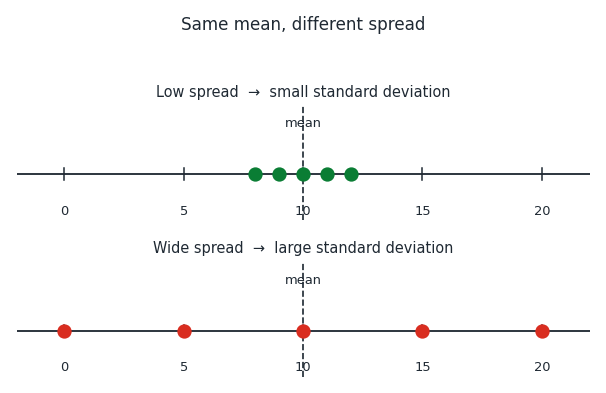
In the picture above, both sets have the same centre, but the blue set is narrow (low standard deviation) and the red set is wide (high standard deviation). To compare two data sets, the one whose values are more spread out has the higher standard deviation.
Adding the same amount to every value shifts the data along but does not change how spread out it is, so the standard deviation stays the same.
If have standard deviation , then also have standard deviation .
If have standard deviation , then also have standard deviation .
Multiplying every value by a number stretches the gaps between them, so the standard deviation is multiplied by too.
If have standard deviation , then have standard deviation .
If have standard deviation , then have standard deviation .
Worked examples
Data Set A has standard deviation and Data Set B has standard deviation . Whose values are more spread out?
A higher standard deviation means more spread.
So Set B's values are more spread out than Set A's.
A higher standard deviation means more spread.
So Set B's values are more spread out than Set A's.
A data set has standard deviation . What is the standard deviation after adding to every value?
Adding the same amount to all values does not change the spread.
So the standard deviation is still .
Adding the same amount to all values does not change the spread.
So the standard deviation is still .
A data set has standard deviation . What is the standard deviation after multiplying every value by ?
Multiplying every value by multiplies the standard deviation by .
So it becomes .
Multiplying every value by multiplies the standard deviation by .
So it becomes .
Celsius readings have standard deviation . Fahrenheit is . What is the standard deviation in Fahrenheit?
Adding does not change the spread, but multiplying by scales it.
So the standard deviation is .
Adding does not change the spread, but multiplying by scales it.
So the standard deviation is .
Is this one of the topics costing you points?
Take the free 10-question diagnostic for a predicted SAT score and a breakdown of which domains are costing you points.