An SAT micro-topic explainer. Free to read — no account needed.
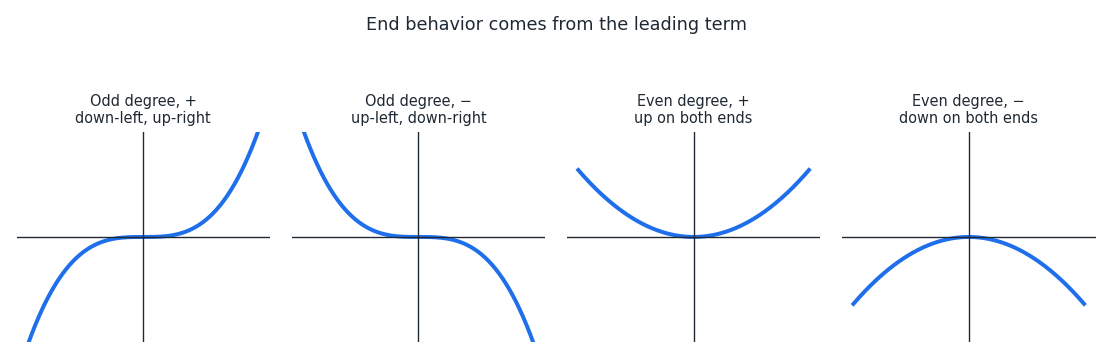
The end behavior of a polynomial describes where its graph heads as x→+∞ (far right) and x→−∞ (far left). Only the leading term — the term with the highest power — matters, because for very large x it dwarfs the others.
If the degree is odd, the two ends point in opposite directions. With a positive leading coefficient, the graph falls on the left and rises on the right. With a negative one, it rises on the left and falls on the right.
If the degree is even, the two ends point the same way. A positive leading coefficient sends both ends up, and a negative one sends both ends down.
End behavior also helps you sketch the middle using the zeros. Knowing which way the graph enters from the left, you can track its sign as it crosses each zero. At a squared factor like (x−3)2 the graph touches the axis and turns back instead of crossing.
Worked examples
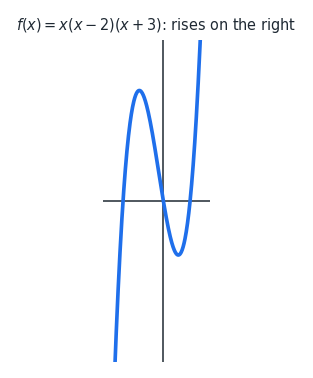
The polynomial f(x)=x(x−2)(x+3) has leading term x3 with a coefficient of 1. What happens as x→+∞? The degree 3 is odd and the leading coefficient is positive. So the graph rises on the right: as x→+∞, f(x)→+∞.
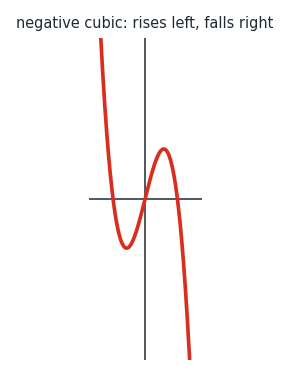
A cubic polynomial q(x) has x-intercepts at −2, 0, and 2, and a negative leading coefficient. What is its end behavior? The degree 3 is odd, so the two ends go opposite ways, and the negative coefficient flips them. So the graph rises on the left (x→−∞, q(x)→+∞) and falls on the right (x→+∞, q(x)→−∞).
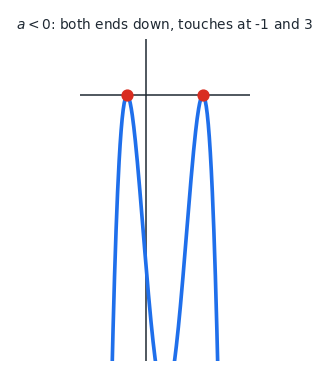
For k(x)=a(x+1)2(x−3)2 with a<0, what does the graph look like? Both (x+1)2 and (x−3)2 are never negative, so their product is ≥0, and multiplying by a<0 makes k(x)≤0 for all x. So the graph never rises above the x-axis, touching it only at x=−1 and x=3, with both ends pointing down.
Is this one of the topics costing you points?
Take the free 10-question diagnostic for a predicted SAT score and a breakdown of which domains are costing you points.