Impact of the constant on the graph
An SAT micro-topic explainer. Free to read — no account needed.
A constant added at the end of a function shifts its graph straight up or down.
Adding moves it up; subtracting moves it down.
Every point moves by the same amount, so the shape stays the same.
Adding moves it up; subtracting moves it down.
Every point moves by the same amount, so the shape stays the same.
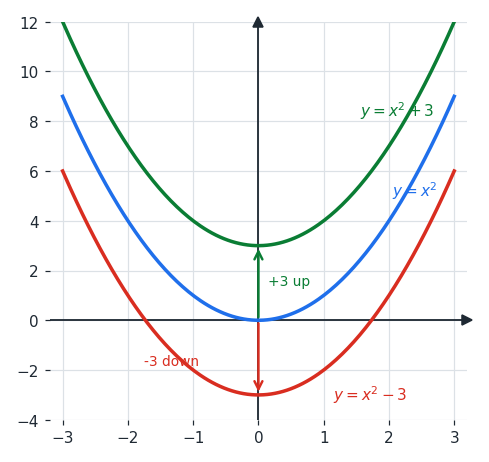
The figure shows a parabola shifted by a constant.
Adding moves every point up by , and subtracting moves every point down by .
The curve keeps its exact shape — only its height changes.
Adding moves every point up by , and subtracting moves every point down by .
The curve keeps its exact shape — only its height changes.
In vertex form , the constant is the -value of the vertex, so it controls the up-down position.
For a line , the constant is the -intercept; shifting the line down by changes to , while the slope stays the same.
For a line , the constant is the -intercept; shifting the line down by changes to , while the slope stays the same.
A constant added at the end does not change the shape or steepness of the graph.
It also does not decide whether the function is increasing or decreasing.
It only slides the graph up or down.
It also does not decide whether the function is increasing or decreasing.
It only slides the graph up or down.
Worked examples
The graph of is shifted down units. What is the new function?
Shifting down by means subtracting from the whole function.
So the new function is .
Shifting down by means subtracting from the whole function.
So the new function is .
The line is shifted down units. What is the new equation?
Subtract from the whole function: .
So , with the same slope and a lower -intercept.
Subtract from the whole function: .
So , with the same slope and a lower -intercept.
Parabola has the same shape as , but its vertex sits units higher. How are their equations related?
Shifting up units means adding to the function.
So .
Shifting up units means adding to the function.
So .
Is this one of the topics costing you points?
Take the free 10-question diagnostic for a predicted SAT score and a breakdown of which domains are costing you points.