Plotting lines parallel to x and y axis
An SAT micro-topic explainer. Free to read — no account needed.
When one variable equals a constant, the graph is a line parallel to an axis.
is horizontal, parallel to the -axis.
is vertical, parallel to the -axis.
is horizontal, parallel to the -axis.
is vertical, parallel to the -axis.
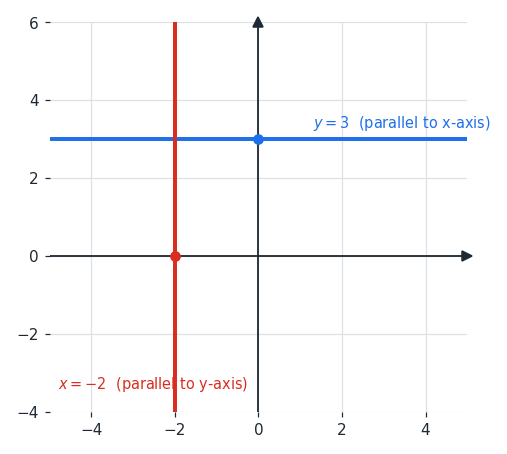
The figure shows both kinds.
The horizontal line keeps fixed while varies, so it runs left-to-right parallel to the -axis.
The vertical line keeps fixed while varies, so it runs up-and-down parallel to the -axis.
The horizontal line keeps fixed while varies, so it runs left-to-right parallel to the -axis.
The vertical line keeps fixed while varies, so it runs up-and-down parallel to the -axis.
A horizontal line crosses the -axis at .
A vertical line crosses the -axis at .
So passes through , and passes through .
A vertical line crosses the -axis at .
So passes through , and passes through .
Sometimes an equation needs rearranging first.
becomes , which is a vertical line, since equals a constant.
Any equation where a single variable equals a constant is a line parallel to an axis.
becomes , which is a vertical line, since equals a constant.
Any equation where a single variable equals a constant is a line parallel to an axis.
Worked examples
What does the line look like?
It is a horizontal line, parallel to the -axis.
Every point on it has , so it crosses the -axis at .
It is a horizontal line, parallel to the -axis.
Every point on it has , so it crosses the -axis at .
What does the line look like?
It is a vertical line, parallel to the -axis.
Every point on it has , so it crosses the -axis at .
It is a vertical line, parallel to the -axis.
Every point on it has , so it crosses the -axis at .
What kind of line is ?
Rewrite it as , which sets equal to a constant.
So it is a horizontal line, parallel to the -axis.
Rewrite it as , which sets equal to a constant.
So it is a horizontal line, parallel to the -axis.
Is this one of the topics costing you points?
Take the free 10-question diagnostic for a predicted SAT score and a breakdown of which domains are costing you points.