Reflecting functions across the x-axis
An SAT micro-topic explainer. Free to read — no account needed.
A reflection across the -axis mirrors a graph from top to bottom.
You form it by negating the whole function, giving .
Each point moves to , keeping the same horizontal position.
You form it by negating the whole function, giving .
Each point moves to , keeping the same horizontal position.
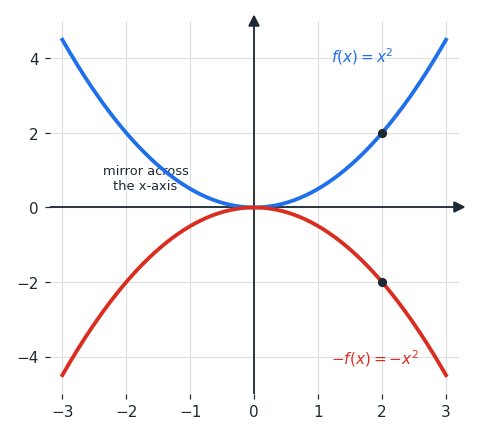
The figure shows a function and its reflection across the -axis.
Each point keeps its -value but flips to the opposite height.
The -axis acts like a mirror between the two curves.
Each point keeps its -value but flips to the opposite height.
The -axis acts like a mirror between the two curves.
To reflect a function across the -axis, put a negative sign in front of the whole thing.
For , the reflection is .
Every output changes sign.
For , the reflection is .
Every output changes sign.
Compare this with a -axis reflection.
An -axis reflection changes the output, , flipping the graph up-down.
A -axis reflection changes the input, , flipping the graph left-right.
An -axis reflection changes the output, , flipping the graph up-down.
A -axis reflection changes the input, , flipping the graph left-right.
Worked examples
Reflect across the -axis. What is the new function?
Negate the whole function: .
So the reflection is .
Negate the whole function: .
So the reflection is .
A point lies on a graph. Where does it go when the graph is reflected across the -axis?
An -axis reflection sends to .
So moves to .
An -axis reflection sends to .
So moves to .
Reflect across the -axis. What is the result?
Put a negative sign in front of the whole function: .
So the reflection is .
Put a negative sign in front of the whole function: .
So the reflection is .
Is this one of the topics costing you points?
Take the free 10-question diagnostic for a predicted SAT score and a breakdown of which domains are costing you points.