An SAT micro-topic explainer. Free to read — no account needed.
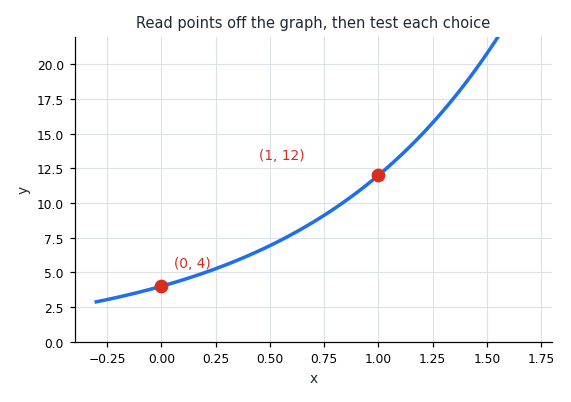
Many graph questions show a curve and give function answer choices, then ask which one models the graph. You read points off the graph and plug their x-values into each choice to see which output matches. Here is a complete example, where the graph passes through (0,4) and (1,12).
Which function is it? (A) f(x)=4⋅3x (B) f(x)=4⋅2x
Read a point and plug in its x-value. At x=0, both choices give 4, so that point cannot separate them. At x=1, the graph shows 12: choice (A) gives 4⋅3=12, matching, while (B) gives 4⋅2=8, which misses, so (A) is the model.
Save time by eliminating with obvious features first. If the graph rises, drop any decaying choice; if the y-intercept is 4, drop any choice that does not give 4 at x=0. Then test the survivors at a point where they disagree, and keep the one that matches.
Worked examples
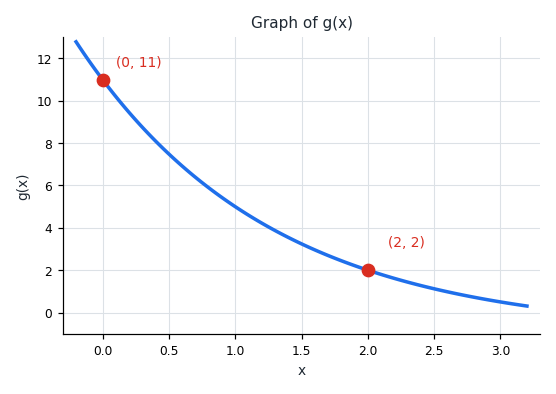
The graph of g(x) passes through (0,11) and (2,2). Which function is it? (A) g(x)=12(21)x−1 (B) g(x)=15(21)x−4 Both choices give about 11 at x=0, so read the second point: at x=2 the graph shows 2. Choice (A) gives 12⋅41−1=2, matching the graph, while (B) gives 15⋅41−4=−0.25, which misses, so (A) is correct.
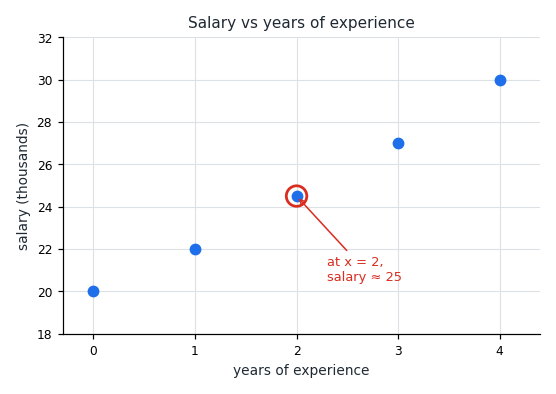
A scatterplot shows salary rising with years of experience; at x=2, the salary is about 25 thousand. Which function models it? (A) f(x)=20+3.5x (B) f(x)=20(1.1)x Read the graph at x=2, where the salary is about 25. Choice (A) gives 20+3.5(2)=27, too high, while (B) gives 20(1.1)2≈24, close to the graph, so (B) is correct.
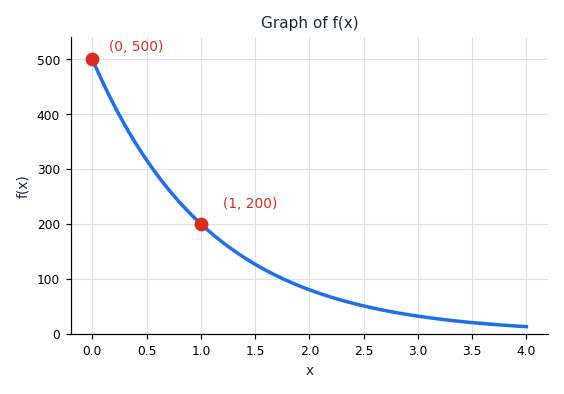
The graph of f(x) passes through (0,500) and (1,200). Which function is it? (A) f(x)=500(0.6)x (B) f(x)=500(0.4)x Both choices give 500 at x=0, so read the point at x=1, where the graph shows 200. Choice (A) gives 500(0.6)=300, too high, while (B) gives 500(0.4)=200, matching the graph, so (B) is correct.
Is this one of the topics costing you points?
Take the free 10-question diagnostic for a predicted SAT score and a breakdown of which domains are costing you points.