understanding elimination of options by reading graphs
An SAT micro-topic explainer. Free to read — no account needed.
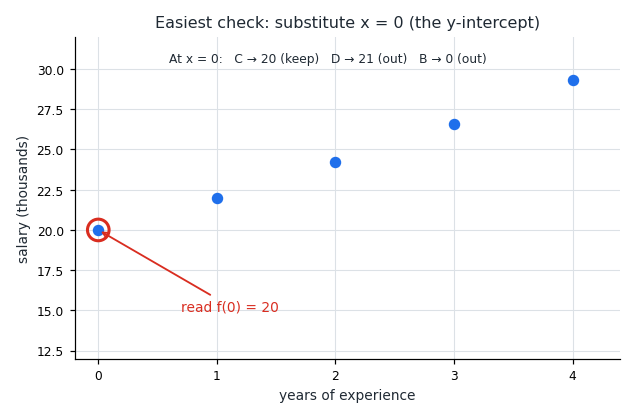
On a graph-modelling question you are asked which function fits a curve or scatterplot. Before testing lots of points, use the y-intercept — the value at x=0 — because it is the easiest point to read and to compute.
Substituting x=0 is quick because most terms collapse. For f(x)=20×1.1x, f(0)=20×1=20, and for f(x)=20+1.1x, f(0)=20+1=21. If the graph clearly starts at 20, the second choice is already out.
The same idea catches choices with the wrong minimum or starting value. A choice like f(x)=20×1.1x gives f(0)=0, so its lowest value is 0, not the $20,000 the graph shows. That mismatch lets you eliminate it without checking any other point.
After the x=0 check, use another easy point only among the survivors. Because one well-chosen point often removes two or three choices, you rarely test all four in full. Read the value the graph gives, compute each remaining choice there, and keep the match.
Worked examples
A graph starts at f(0)=30. Which function fits? (A) f(x)=30×1.2x (B) f(x)=30+1.2x At x=0, (A) gives 30×1=30, matching the graph. (B) gives 30+1=31, which misses, so (A) is correct.
The graph's minimum value is 15, reached at x=0. Which choice can you eliminate? (A) f(x)=15×1.2x (B) f(x)=15+2x At x=0, (A) gives 15×1.2×0=0, so its minimum is 0, not 15. (B) gives 15, which matches, so eliminate (A).
A curve passes through (0,5). Which function fits? (A) f(x)=5(2)x (B) f(x)=3(2)x At x=0, (A) gives 5×1=5, matching the intercept. (B) gives 3, which misses, so (A) is correct.
Is this one of the topics costing you points?
Take the free 10-question diagnostic for a predicted SAT score and a breakdown of which domains are costing you points.