Basic data inference
An SAT Math micro-topic under Data inferences (Problem solving and data analysis). Free to read — no account needed.
Data inference uses a small, well-chosen sample to draw conclusions about a much larger population. If the sample is random and representative, the fraction found in the sample carries over to the whole population.
For example, if of sampled shoppers prefer a brand, that is , so out of shoppers you would estimate prefer it.
For example, if of sampled shoppers prefer a brand, that is , so out of shoppers you would estimate prefer it.
The catch is representativeness: an inference can only be extended to the exact population the sample stands for. A survey of male cricket fans in India says nothing reliable about all cricket fans in India, or about male fans worldwide, because the sample does not represent those groups.
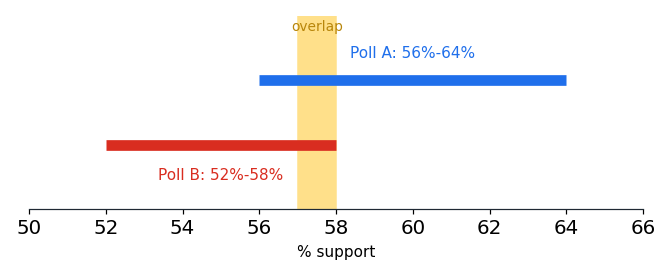
Because a sample is only an estimate, results are often reported as a confidence interval: a range within which the population's true value is likely to lie. Two intervals overlap when they share values, as shown below, which means the polls do not necessarily disagree.
Worked examples
In a random sample of students, play soccer, a proportion of . Applied to the full population of students, the estimate is soccer players.
Poll A gives a confidence interval of to , and Poll B gives to . They share the values from to , so the intervals overlap there, meaning the two polls do not necessarily disagree.
Is this one of the topics costing you points?
Take the free 10-question diagnostic for a predicted SAT score and a breakdown of which domains are costing you points.