Margin of error
An SAT Math micro-topic under Data inferences (Problem solving and data analysis). Free to read — no account needed.
A margin of error tells you how far the true value might be from the estimate.
You subtract the margin to get the lower bound and add it to get the upper bound.
That band is the range of plausible values, called the confidence interval.
You subtract the margin to get the lower bound and add it to get the upper bound.
That band is the range of plausible values, called the confidence interval.
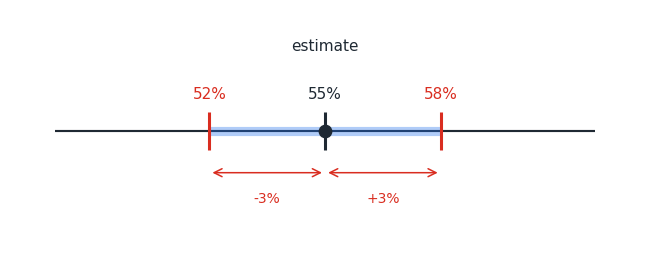
The figure shows an estimate with its margin of error.
The interval reaches the margin below the estimate and the margin above it.
The true value is likely to lie somewhere inside that band.
The interval reaches the margin below the estimate and the margin above it.
The true value is likely to lie somewhere inside that band.
To build the interval, take the estimate and go the margin below and above.
A poll of with a margin of gives to .
A plausible value must lie in that range.
A poll of with a margin of gives to .
A plausible value must lie in that range.
You can also work backward from an interval.
If the interval runs from to , the estimate is the center, , and the margin is half the width, .
A wider interval means a larger margin of error.
If the interval runs from to , the estimate is the center, , and the margin is half the width, .
A wider interval means a larger margin of error.
Worked examples
A poll shows support with a margin of error of . What is the likely range?
Subtract and add the margin: and .
So the range is to .
Subtract and add the margin: and .
So the range is to .
A poll of voters shows support with a margin of error of . What is the likely range in number of voters?
The percentage range is to .
In voters, that is of up to of .
The percentage range is to .
In voters, that is of up to of .
A confidence interval runs from to . What are the estimate and the margin of error?
The estimate is the center: .
The margin is half the width: .
The estimate is the center: .
The margin is half the width: .
Is this one of the topics costing you points?
Take the free 10-question diagnostic for a predicted SAT score and a breakdown of which domains are costing you points.