Comparing slopes through graphs
An SAT Math micro-topic under Data representations (Problem solving and data analysis). Free to read — no account needed.
The slope of a line tells you two things at once: how steep it is, and whether it tilts up or down. A bigger size of slope means a steeper line. A line rising from left to right has a positive slope, and a line falling from left to right has a negative slope.
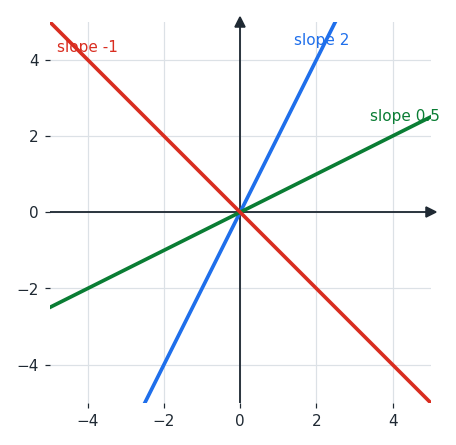
In the graph above, the steepest line is the one with slope ; the line with slope rises more gently; and the line with slope falls, so its slope is negative.
To compare slopes on a graph, use steepness for the size and direction for the sign. A line rising more sharply has a larger positive slope, and a line falling more sharply has a more negative slope. And remember: any positive slope is greater than any negative slope.
You can read the actual slope as rise over run: how far the line goes up for each step to the right. A line that rises for every across has slope .
Worked examples
Line P rises units for every unit across, and Line Q rises unit for every across. Which has the greater slope?
Line P rises more steeply, so its slope is greater than Line Q's slope .
Line P rises more steeply, so its slope is greater than Line Q's slope .
Line M goes up from left to right, and Line N goes down. Which has the greater slope?
Line M has a positive slope and Line N has a negative slope.
Any positive slope is greater than a negative one, so Line M has the greater slope.
Line M has a positive slope and Line N has a negative slope.
Any positive slope is greater than a negative one, so Line M has the greater slope.
A line rises units for every units across. What is its slope?
Slope is rise over run:
.
Slope is rise over run:
.
Is this one of the topics costing you points?
Take the free 10-question diagnostic for a predicted SAT score and a breakdown of which domains are costing you points.