Exponential graphs
How the SAT tests this, with worked examples — plus the 2 skills it covers. Free to read, no account needed.
An exponential function has the form , where is the starting value and the multiplier applied each step. Its graph curves rather than bending at a point.
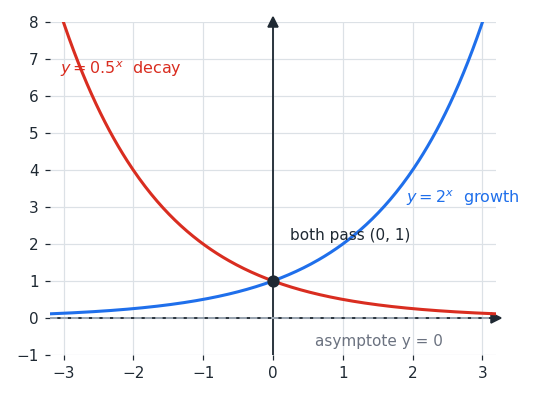
When the function grows and the curve rises ever more steeply. When it decays and the curve falls toward the axis. Both pass through , because anything to the power zero is .
The flat line the curve approaches is the asymptote. For it is , and the curve gets arbitrarily close without ever touching it. Adding a constant shifts the asymptote: approaches .
The difference from a line is worth stating plainly. A linear function adds the same amount each step; an exponential multiplies by the same factor. That is why exponential growth eventually overtakes any linear growth, however steep the line.
Worked examples
What is the -intercept of ?
Set , and since
Set , and since
Does grow or decay?
- AGrows
- BDecays
The multiplier is between and , so each step halves the value, making (B) correct.
Is exponential graphs costing you points?
Take the free 10-question diagnostic for a predicted SAT score and a breakdown of which domains are costing you points.