An SAT Math micro-topic under Quadratic graphs (Advanced Math). Free to read — no account needed.
Every parabola has a single turning point called the vertex. If the parabola opens upward the vertex is the minimum; if it opens downward the vertex is the maximum.
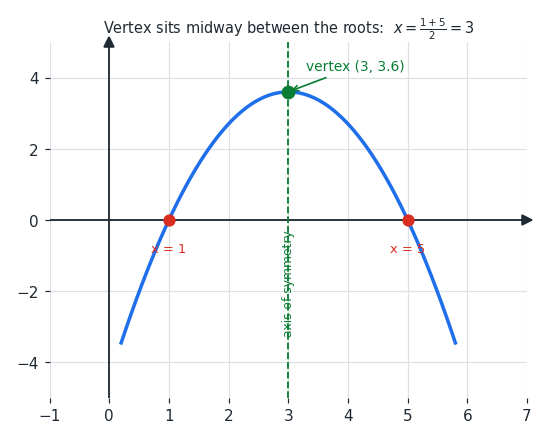
The vertex sits on the axis of symmetry, the vertical line that splits the parabola into mirror halves. Because the two x-intercepts are mirror images, the axis is exactly halfway between them. For intercepts at x=1 and x=5, the vertex is at x=21+5=3.
Once you have the x-coordinate, the y-coordinate comes from substituting it into the equation. Plugging that x back in gives the height of the turning point, which is the function's maximum or minimum value. So a maximum value of 12 at x=1 means the vertex is (1,12).
When the equation is in vertex formy=a(x−h)2+k, you can read the vertex directly as (h,k). The axis of symmetry is also useful for finding a matching point: any point on the parabola has a mirror twin the same distance on the other side of the axis. A point at x=2 on the axis x=4 has its twin at x=6.
Worked examples
A parabola has x-intercepts at x=−2 and x=4. What is the x-coordinate of its vertex? The vertex lies midway between the intercepts. So x=2−2+4=1.
A downward parabola reaches a maximum value of 8 at x=3. What is its vertex? The vertex is the turning point, here the maximum, at x=3. Since the maximum value is 8, the vertex is (3,8).
The vertex of f(x)=2x2−8x+5 is at (2,−3), and point A on the parabola is at x=1. What is the x-coordinate of its mirror point B? A and B are symmetric about the axis x=2, and A is 1 unit to the left. So B is 1 unit to the right, at x=3.
Is this one of the topics costing you points?
Take the free 10-question diagnostic for a predicted SAT score and a breakdown of which domains are costing you points.