An SAT Reading & Writing micro-topic under Command of Evidence: Quantitative (Information and Ideas). Free to read — no account needed.
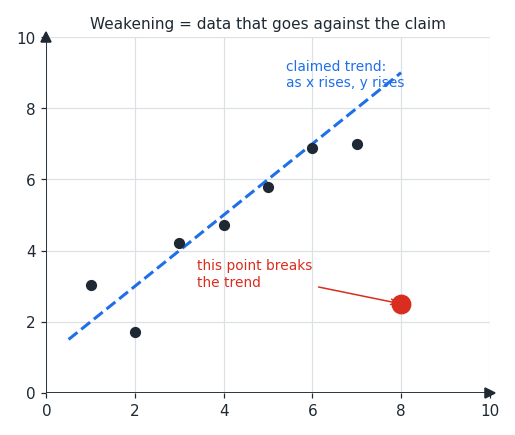
Some questions state a hypothesis about a trend in data and ask which numbers would weaken it. The claim might be that as one quantity rises, another rises too. Your job is to find the point that breaks that pattern — for instance, a scatterplot point sitting far below an otherwise rising trend.
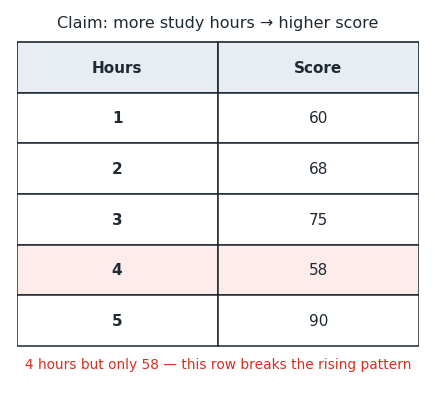
So read the hypothesis, note what it predicts, then scan the table for a row that does the opposite. Suppose the claim is that more study hours give a higher score. In the table below, the 4-hour student scored only 58 — lower than the 3-hour student — so that row moves the wrong way and weakens the claim.
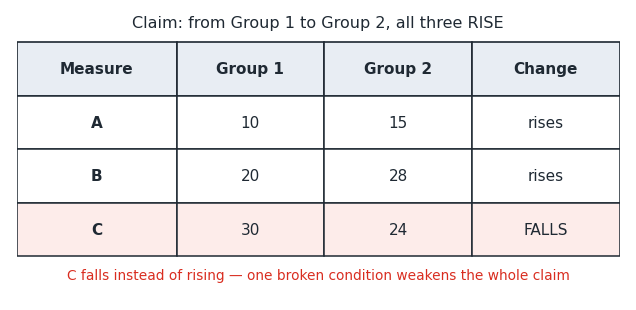
Watch for hypotheses that require several conditions to hold at once. If a claim says three measures all rise from one group to the next, then even one measure going the wrong way is enough to weaken it. In the table below, A and B rise as predicted, but C falls — that single broken condition weakens the whole claim.
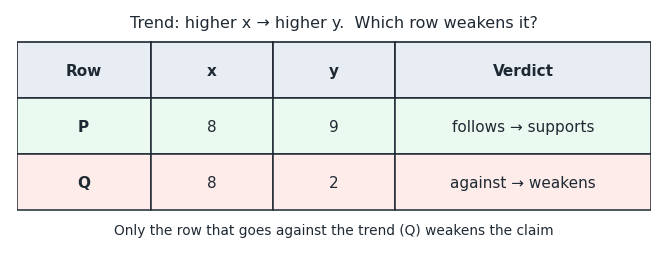
Finally, be careful to separate weakening data from supporting data. A row that follows the predicted pattern supports the hypothesis, so it is a wrong answer. In the table below, row P follows the trend (higher x, higher y) and supports it, while only row Q — higher x but lower y — weakens it.
Worked examples
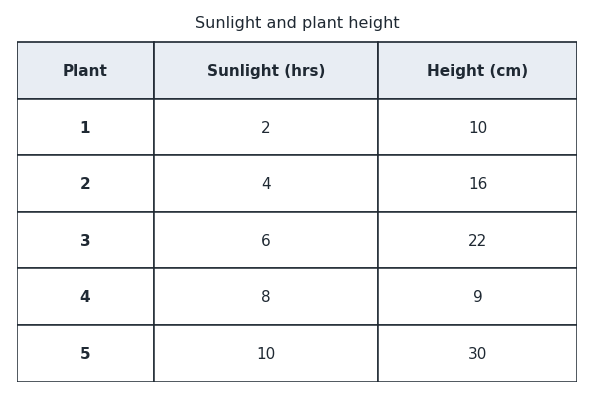
A researcher claims that the more sunlight a plant gets, the taller it grows. The table below shows five plants. Which plant's data weakens the claim? (A) Plant 5 (B) Plant 4 Plant 4 received 8 hours of sunlight but is only 9 cm tall — shorter than plants that got less sunlight — so its data goes against the pattern. Plant 5 got the most sunlight and is the tallest, so it follows the pattern. So (B) weakens the claim.
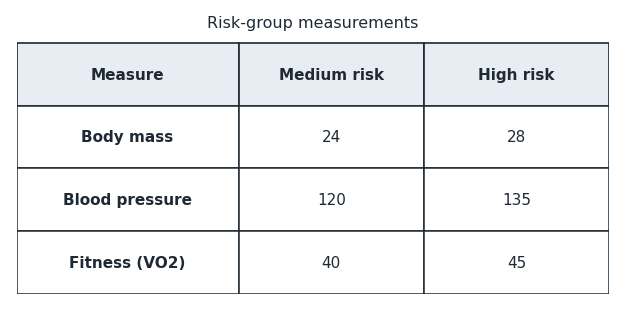
A researcher hypothesizes that higher-risk people have higher body mass, higher blood pressure, and lower fitness — all three together. The table below compares the medium- and high-risk groups. Does this data support or weaken the hypothesis? (A) It weakens the hypothesis. (B) It supports the hypothesis. From medium to high risk, body mass and blood pressure both rise as predicted, but fitness rises from 40 to 45 instead of falling. Because the claim requires all three conditions, the rising fitness breaks it. So (A), the data weakens the hypothesis.
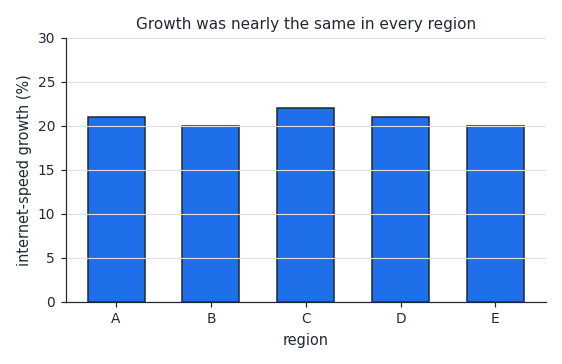
A researcher argues that a few regions grew especially fast because of special local factors, not just the shared infrastructure. The chart below shows the growth of five regions. Does this data support or weaken the argument? (A) It weakens the argument. (B) It supports the argument. Every region grew by nearly the same amount, about 20 to 22 percent. Uniform growth like this points to the shared infrastructure, not to special local factors. So (A), the data weakens the argument.
Is this one of the topics costing you points?
Take the free 10-question diagnostic for a predicted SAT score and a breakdown of which domains are costing you points.