Finding solutions of a system of equations
An SAT Math micro-topic under Linear and quadratic systems (Advanced Math). Free to read — no account needed.
A solution to a system is a point that makes all of the equations true simultaneously. On a graph, that is exactly where the curves cross, since a crossing point lies on both graphs at once.
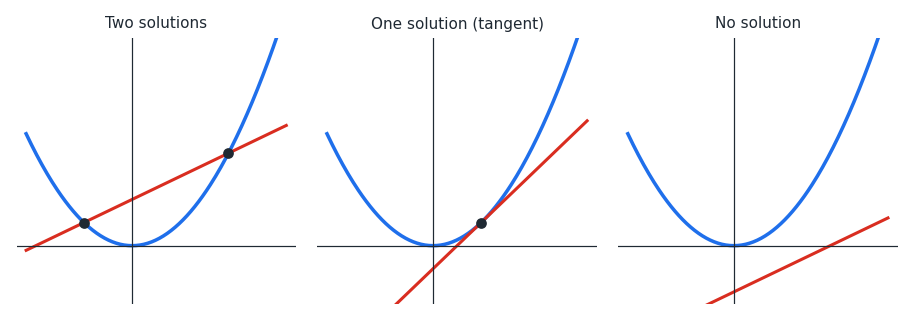
The figure shows a line and a parabola. They may cross at two points (two solutions), touch at exactly one point where the line is tangent (one solution), or never meet (no solution).
To solve algebraically when both equations give , set them equal. For and : , so , which factors as , giving or .
Finding is only half the answer — put each back into either equation to get . At , ; at , . So the solutions are the points and .
Worked examples
Solve the system and .
Set the right sides equal: , so , which factors as .
Then : the solutions are and .
Set the right sides equal: , so , which factors as .
Then : the solutions are and .
A line and a parabola form a system with exactly one solution. What does that mean graphically?
Exactly one solution means the graphs meet at exactly one point — the line is tangent to the parabola, just touching it.
Exactly one solution means the graphs meet at exactly one point — the line is tangent to the parabola, just touching it.
The system and has solutions at and . Which one satisfies ?
Substitute into : at , , so . At , , so .
The answer is .
Substitute into : at , , so . At , , so .
The answer is .
Is this one of the topics costing you points?
Take the free 10-question diagnostic for a predicted SAT score and a breakdown of which domains are costing you points.