graphing equation of a straight line y= mx + c
An SAT Math micro-topic under Graphs of linear systems and inequalities (Algebra). Free to read — no account needed.
A straight line is fixed by any two points, so to graph one you find two points and connect them. The intercepts — where the line meets the axes — are usually the easiest pair to find.
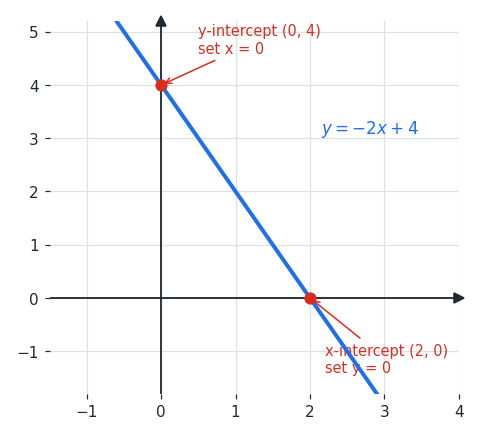
In the figure, the line is drawn through its intercepts. Set for the -intercept , and set for the -intercept .
You can also use slope-intercept form directly: in , the value is the -intercept, so plot first, then use the slope as rise over run to step to a second point. For , plot , then go up and right to .
If the line is given in a rearranged form like , just find the two intercepts directly: at , so ; at , so .
Worked examples
Graph using its intercepts.
-intercept (set ): .
-intercept (set ): , so , giving . Draw the line through these two points.
-intercept (set ): .
-intercept (set ): , so , giving . Draw the line through these two points.
Graph using its intercepts.
-intercept (set ): , so , the point .
-intercept (set ): , so , the point .
-intercept (set ): , so , the point .
-intercept (set ): , so , the point .
Graph using the slope.
Start at the -intercept .
The slope is , so go down and right to . Draw the line through both points.
Start at the -intercept .
The slope is , so go down and right to . Draw the line through both points.
Is this one of the topics costing you points?
Take the free 10-question diagnostic for a predicted SAT score and a breakdown of which domains are costing you points.