An SAT Math micro-topic under Graphs of linear systems and inequalities (Algebra). Free to read — no account needed.
Graphing a linear inequality has two parts: draw the boundary line, then shade a whole region. For the boundary, pretend the sign is = and graph that line, which splits the plane into two halves.
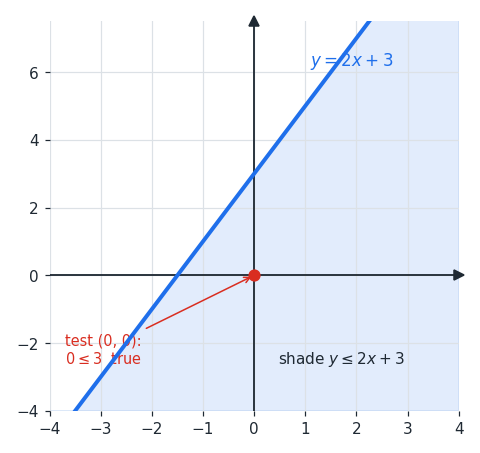
In the figure the boundary line y=2x+3 is drawn and the region for y≤2x+3 is shaded. Testing (0,0): 0≤3 is true, so the origin lies in the solution — confirming we shade the side that contains it.
Make the boundary solid when equality is allowed (≤, ≥), because those points on the line count as solutions, and dashed for strict inequalities (<, >), because the line itself is excluded.
To decide which side to shade, pick any point not on the line — (0,0) is easiest whenever the line misses the origin — and substitute it into the inequality. If it comes out true, shade that side; if false, shade the other side.
Worked examples
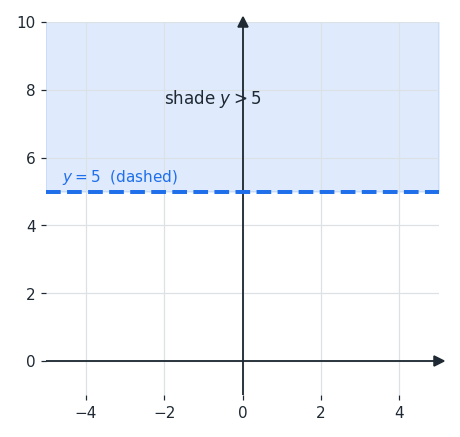
Graph y>5. Draw the horizontal line y=5, dashed because the inequality is strict. Shade above it, since y>5 means every point with y-coordinate greater than 5.
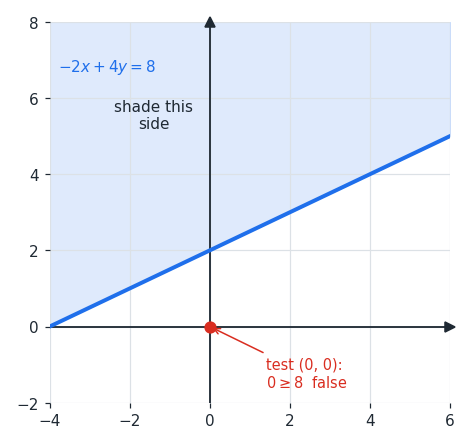
Which side do you shade for −2x+4y≥8? Draw the solid line −2x+4y=8. Test (0,0): −2(0)+4(0)=0, and 0≥8 is false. Since (0,0) fails, shade the side that does not contain the origin.
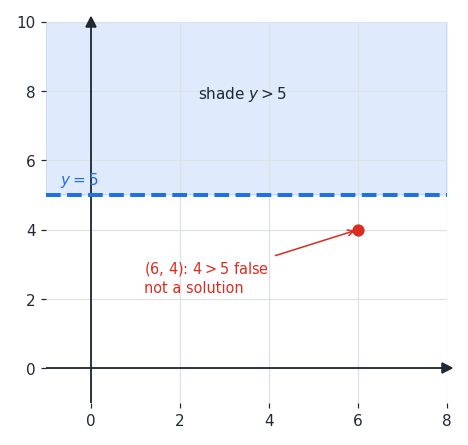
Is (6,4) a solution to y>5? Substitute the y-coordinate: 4>5 is false. So (6,4) is not a solution — it lies outside the shaded region.
Is this one of the topics costing you points?
Take the free 10-question diagnostic for a predicted SAT score and a breakdown of which domains are costing you points.