Command of Evidence: Quantitative
How the SAT tests this, with worked examples — plus the 4 skills it covers. Free to read, no account needed.
Here the evidence is a graph or table rather than a quotation. Reading it is rarely hard; the care is in matching the data to exactly what the claim requires.
One question asks you to support a claim, the next to weaken one.
Worked examples
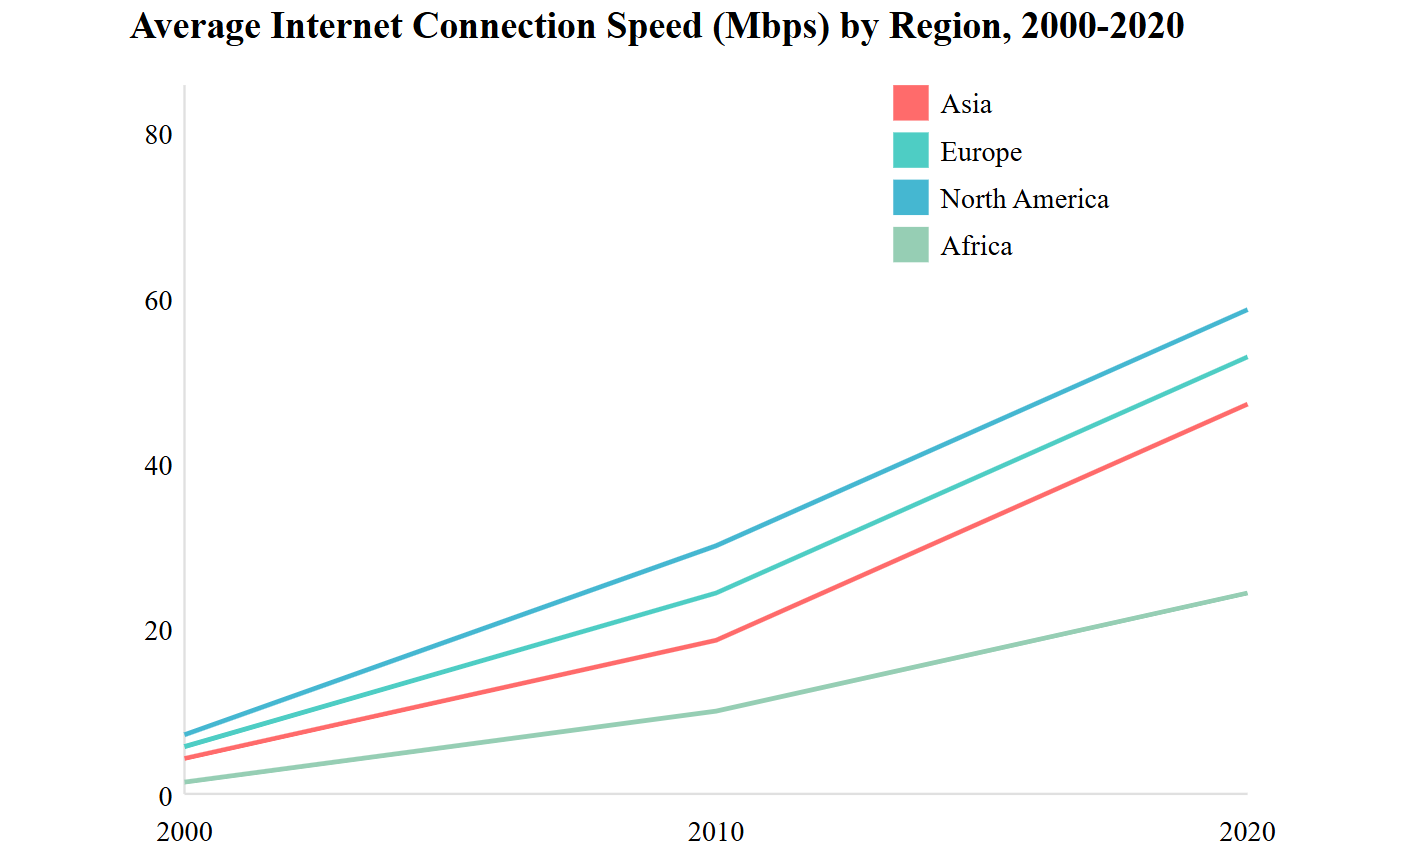
A technology researcher examining global internet speeds notes that while improving infrastructure drove speed increases across all regions, certain areas saw particularly dramatic growth. The researcher argues there must be region-specific factors beyond infrastructure improvements.
Which choice best supports the researcher's argument?
- AInternet speeds increased in all regions between 2000 and 2020.
- BNorth America maintained the highest speeds throughout the period.
- CAsia's average speed tripled between 2010-2020 while Europe's only doubled, despite similar infrastructure investments.
- DAfrica showed steady but slower growth compared to other regions.
Read the graph first. All four regions climb steadily from 2000 to 2020, and North America stays on top throughout. But look at 2010 onward: Asia rises from roughly 19 to about 48 Mbps, a far larger multiple than Europe's climb from about 25 to 53 — even though Asia ends lower.
The claim is that something beyond infrastructure is at work. To support it you need two regions whose infrastructure was comparable but whose growth differed; otherwise infrastructure alone explains everything.
(C) is correct, and the phrase despite similar infrastructure investments is doing the work. Hold infrastructure constant, see different results, and another factor must exist.
(A) is true of the graph but actively undercuts the claim: uniform growth everywhere is exactly what infrastructure alone would produce.
(B) is also true of the graph — North America is the top line — but a ranking says nothing about why, so it cannot support a claim about causes.
(D) reads Africa's lower line correctly, yet gives no reason to think Africa's infrastructure matched the others'. If its infrastructure lagged, infrastructure is the whole story.
Notice that three of the four choices describe the graph accurately. Being true is not the test; only (C) holds one factor fixed while the outcome varies.
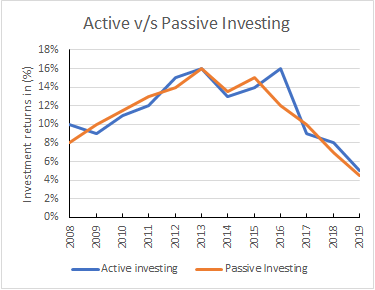
A finance trader analysing investment returns from 2008 to 2019 hypothesises that active investing will always generate higher returns than passive investing.
Which choice best describes data from the graph that weaken the trader's hypothesis?
- AActive investing always outperformed passive investing between 2008 - 2019
- BPassive investing always outperformed active investing between 2008 - 2019
- CActive investing outperformed passive investing from 2018 onwards
- DActive investing did worse than passive investing between 2009 and 2011
Trace the two lines. They cross repeatedly: active starts above, dips below passive through the early years, the two converge around 2013, active peaks higher in 2016, and both fall away by 2019. Neither line is above the other throughout.
The hypothesis contains the word always. A universal claim is broken by a single counterexample — you do not have to prove the reverse.
(D) is correct: the graph plainly shows active below passive in 2009 to 2011, and one such stretch is enough to defeat "always".
(A) and (B) both misrepresent the graph, because neither approach is ahead for the whole period. (A) would also support the hypothesis rather than weaken it.
(C) points at a stretch where active is ahead, which strengthens the trader's case — the opposite of what the question asks for.
Set the two questions side by side: to support a claim, supply the thing it requires; to weaken one, find the single case it cannot survive.
Is command of evidence: quantitative costing you points?
Take the free 10-question diagnostic for a predicted SAT score and a breakdown of which domains are costing you points.