Data representations
How the SAT tests this, with worked examples — plus the 2 skills it covers. Free to read, no account needed.
These questions ask you to read a chart rather than build one, and the main skill is knowing what each kind of chart is for.
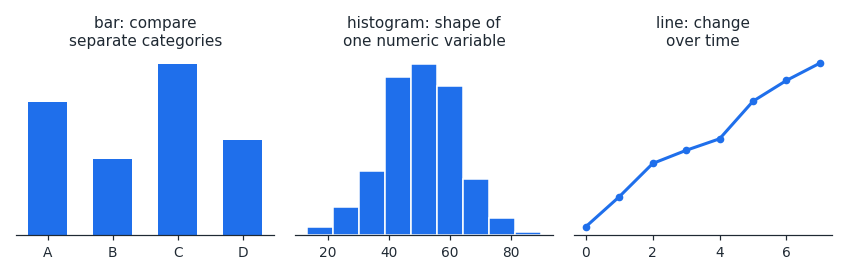
A bar chart compares separate categories, and the bars have gaps because the categories are unrelated. A histogram shows the shape of one numeric variable split into intervals, so its bars touch. A line graph shows change over time.
Always read the axes and any key before the data. A surprising number of wrong answers come from misreading the scale, missing that an axis does not start at zero, or confusing two plotted series.
For a histogram you can read shape directly: where the tall bars sit shows where most values lie, and a long tail on one side means the distribution is skewed that way.
A frequent trap is a question asking for an exact value a chart cannot give. A histogram shows how many values fall in the – interval, but not what any individual value was.
Worked examples
A histogram shows values in the \u2013 interval.
What is the largest of those values?
It cannot be determined. A histogram records how many values fall in each interval, not the individual values.
What is the largest of those values?
It cannot be determined. A histogram records how many values fall in each interval, not the individual values.
Which chart best shows a company's revenue each year from 2016 to 2022?
- AHistogram
- BLine graph
The data is a quantity changing over time, which is exactly what a line graph shows, so (B) is correct.
Is data representations costing you points?
Take the free 10-question diagnostic for a predicted SAT score and a breakdown of which domains are costing you points.