Quadratic graphs
How the SAT tests this, with worked examples — plus the 2 skills it covers. Free to read, no account needed.
A quadratic graphs as a parabola, and which form the equation is written in decides which feature you get for free.
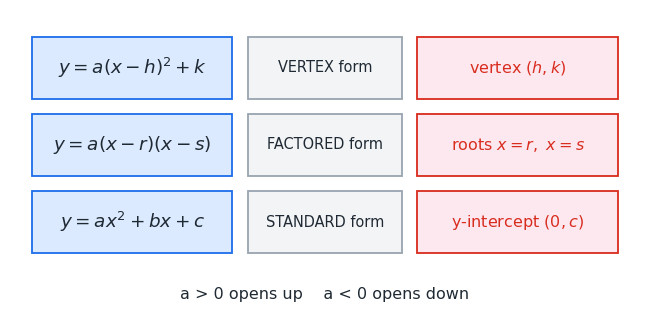
Vertex form hands you the turning point directly — minding the sign, since means . Factored form hands you the roots. Standard form hands you the -intercept .
The sign of decides the direction: positive opens upward with a minimum at the vertex, negative opens downward with a maximum.
A parabola is symmetric about the vertical line through its vertex, which gives a useful shortcut — the vertex sits exactly halfway between the roots. If the roots are and , the vertex is at .
So when a question asks for a maximum or minimum value, it is asking for the -coordinate of the vertex, and when it asks where that occurs, it wants the -coordinate.
Worked examples
Give the vertex of .
Reading vertex form, the vertex is , and since the parabola opens downward — so is a maximum.
Reading vertex form, the vertex is , and since the parabola opens downward — so is a maximum.
A parabola has roots at and . Where is its axis of symmetry?
The vertex lies halfway between the roots
The vertex lies halfway between the roots
Is quadratic graphs costing you points?
Take the free 10-question diagnostic for a predicted SAT score and a breakdown of which domains are costing you points.