Calculating x and y intercepts
An SAT Math micro-topic under Graphs of linear equations and functions (Algebra). Free to read — no account needed.
The intercepts of a graph are the points where it meets the axes. The y-intercept is where the graph crosses the y-axis; every point on the y-axis has . The x-intercept is where it crosses the x-axis; every point on the x-axis has .
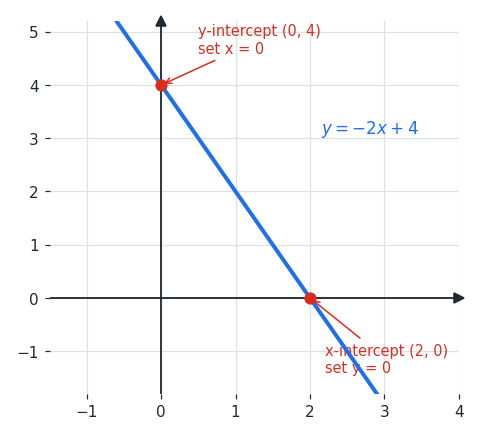
In the graph above, the line crosses the y-axis at and the x-axis at .
To find the y-intercept, set : , giving .
To find the x-intercept, set : , so , giving .
To find the y-intercept, set : , giving .
To find the x-intercept, set : , so , giving .
The same idea works for any function, not just lines. For a curve like , the y-intercept is , because .
Worked examples
Find the y-intercept of .
Set : .
So the y-intercept is .
Set : .
So the y-intercept is .
Find the x-intercept of .
Set : , so and .
So the x-intercept is .
Set : , so and .
So the x-intercept is .
Find the y-intercept of .
Set : , since .
So the y-intercept is .
Set : , since .
So the y-intercept is .
Is this one of the topics costing you points?
Take the free 10-question diagnostic for a predicted SAT score and a breakdown of which domains are costing you points.