An SAT Math micro-topic under Scatterplots (Problem solving and data analysis). Free to read — no account needed.
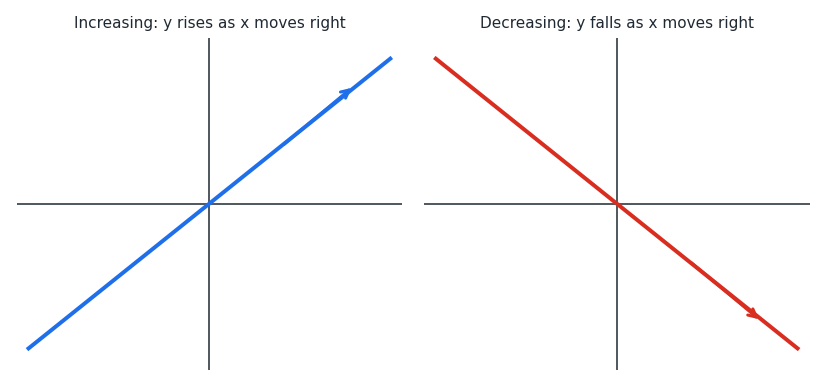
A graph increases where y gets larger as x moves right, and decreases where y gets smaller. So you read a graph from left to right and watch whether it rises or falls.
The figure shows both cases. On the left, the line rises as x increases, so it is increasing. On the right, the line falls as x increases, so it is decreasing.
For a line y=mx+b, the sign of the slope m decides it. If m>0 the line increases; if m<0 the line decreases. So a scatterplot with a downward trend needs a line with a negative slope.
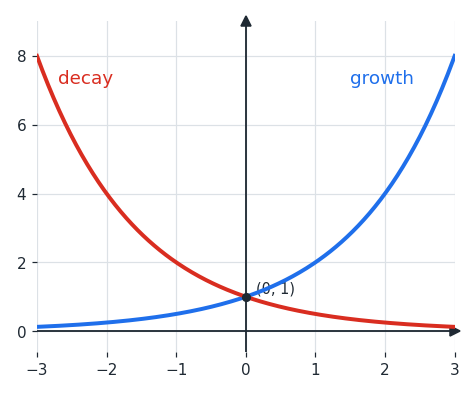
For an exponential y=a⋅bx with a>0, the base b decides the direction. If b>1 the graph increases (grows); if 0<b<1 it decreases (decays). For example, y=3⋅1.2x increases, while y=3⋅0.8x decreases.
Worked examples
Is the line y=−2x+5 increasing or decreasing? The slope is −2, which is negative. So as x increases, y decreases — the line is decreasing.
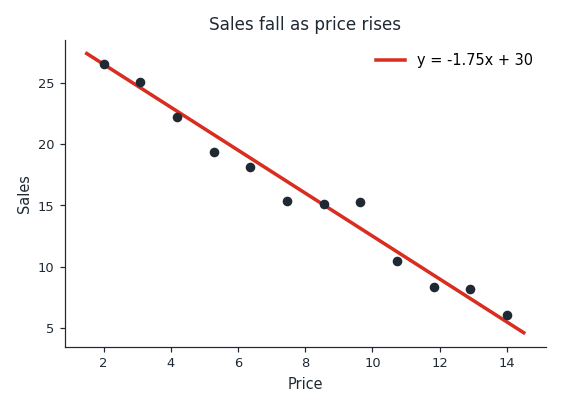
A scatterplot shows sales falling as price rises. Which line could fit: y=1.75x+30 or y=−1.75x+30? A falling trend needs a negative slope. So y=−1.75x+30 fits, because its slope −1.75 is negative.
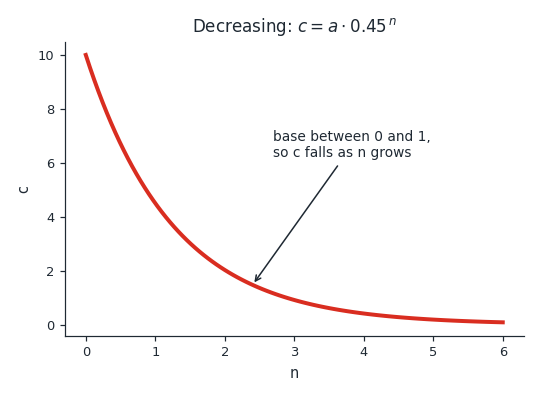
Does c=a⋅0.45n increase or decrease as n grows, given a>0? The base is 0.45, which is between 0 and 1. So as n increases, the value decreases — the graph is decreasing.
Is this one of the topics costing you points?
Take the free 10-question diagnostic for a predicted SAT score and a breakdown of which domains are costing you points.