An SAT Math micro-topic under Scatterplots (Problem solving and data analysis). Free to read — no account needed.
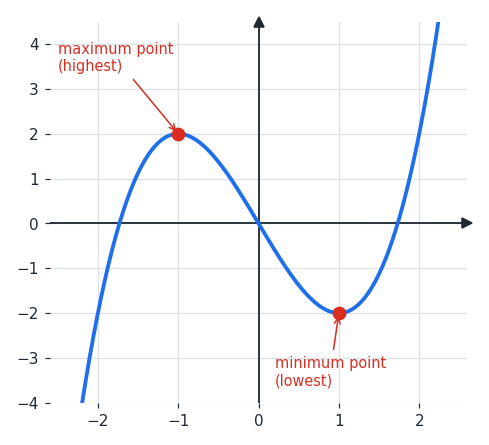
The maximum point of a graph is where the curve is highest, and the minimum point is where it is lowest. The value you report is the y-coordinate at that point. These are the turning points of the curve.
The figure shows a curve with both a maximum and a minimum. The maximum is where the curve stops rising and turns downward; the minimum is where it stops falling and turns upward. Read the value from the height of each point.
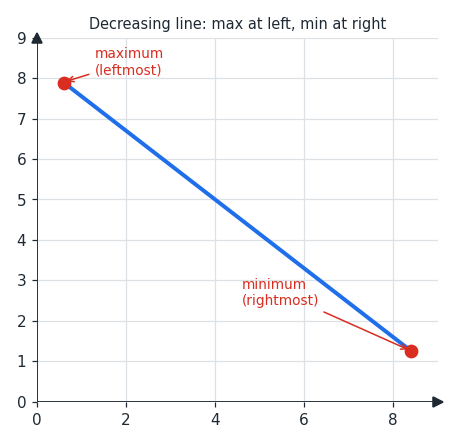
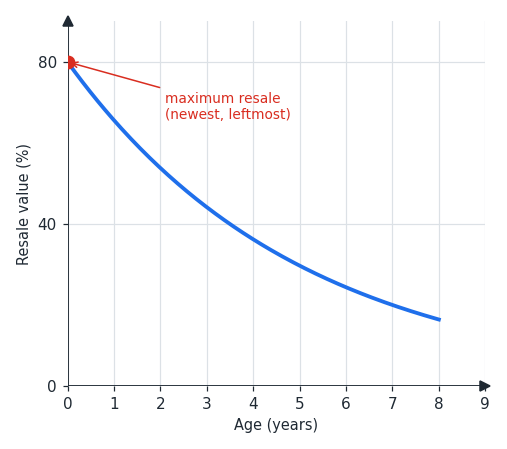
On a graph that only rises or only falls, the highest and lowest points are at the ends. For a trend line that decreases as you move right, the maximum is the leftmost point and the minimum is the rightmost. So a car's resale value that falls with age is largest when the car is newest, at the leftmost point.
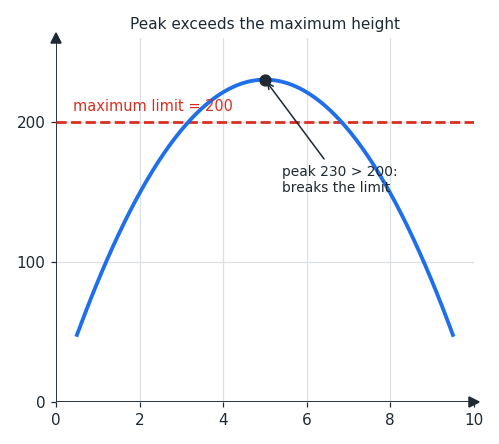
Some problems set a limit, like a ride that must stay below a maximum height. You check whether the highest point of the graph rises above that limit, or the lowest point drops below it. A graph that breaks either limit can be ruled out.
Worked examples
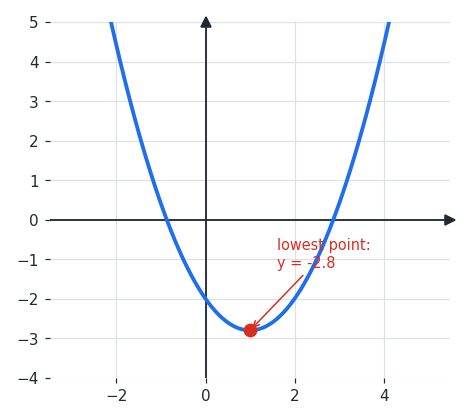
The lowest point on the graph of f(x) is at y=−2.8. What is the minimum value of f(x)? The minimum value is the y-coordinate of the lowest point. So the minimum value is −2.8.
A trend line shows a car's resale value falling as its age increases. Where is the maximum resale value? Since the line decreases as you move right, the highest point is on the far left. So the maximum resale value is at the leftmost point, when the car is newest.
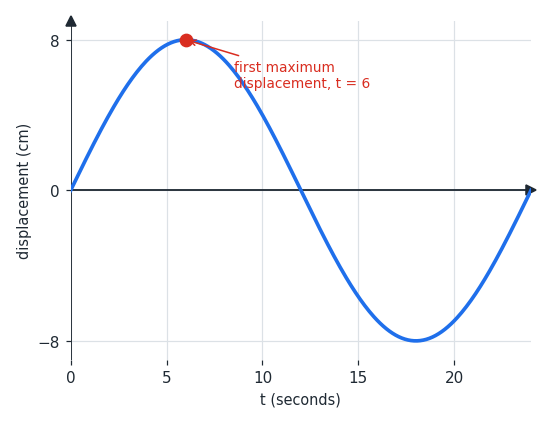
A pendulum's displacement graph reaches its first highest point at t=6 seconds. What does that point represent? The highest point is the maximum displacement. So it represents the greatest displacement, reached 6 seconds after release.
Is this one of the topics costing you points?
Take the free 10-question diagnostic for a predicted SAT score and a breakdown of which domains are costing you points.