An SAT Math micro-topic under Scatterplots (Problem solving and data analysis). Free to read — no account needed.
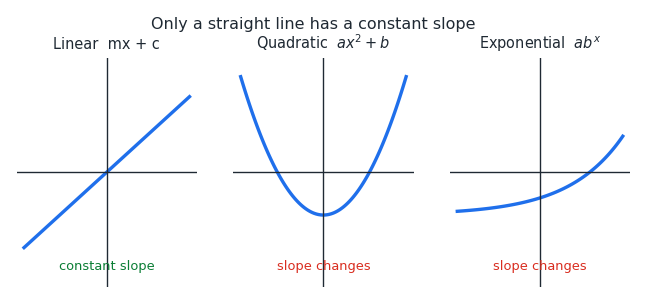
The slope of a graph is how steeply it rises or falls, and whether it stays the same tells you the type of function. A slope that never changes belongs to a straight line; a slope that changes belongs to a curve.
A linear function y=mx+c has a constant slope m. Every time x increases by 1, y changes by the same amount m, which is why its graph is a straight line. Even y=xab is linear, because ab is just a constant playing the role of m.
A quadratic function y=ax2+b does not have a constant slope. Its graph is a U-shape (or an upside-down U), so it falls and then rises, meaning the steepness changes from point to point. The slope is different everywhere along the curve.
An exponential function y=abx also has a changing slope. It grows (or decays) by a constant factor rather than a constant amount, so each step in x multiplies y, making the curve steepen or flatten. Adding a constant, as in 20+1.1x, shifts it up but does not make the slope constant.
Worked examples
Which function does NOT have a constant slope? (A) f(x)=20+3.46x (B) f(x)=20×1.1x Choice (A) is in the form mx+c with m=3.46, so its slope is constant. Choice (B) is exponential, of the form abx, so its slope changes; (B) is the answer.
Which function has a constant slope? (A) f(x)=x2+3 (B) f(x)=4x Choice (A) is quadratic, so its U-shaped graph has a changing slope. Choice (B) is of the form mx, a straight line with slope 4, so (B) has the constant slope.
Is f(x)=20+1.1x a constant-slope function? (A) yes (B) no The 1.1x term is exponential, and adding 20 only shifts the graph up without straightening it. So the slope still changes, and the answer is (B), no.
Is this one of the topics costing you points?
Take the free 10-question diagnostic for a predicted SAT score and a breakdown of which domains are costing you points.