An SAT Math micro-topic under Scatterplots (Problem solving and data analysis). Free to read — no account needed.
The slope of a line is the change in y divided by the change in x. Its sign tells you the direction: a line that rises from left to right has a positive slope, one that falls has a negative slope. A flat, horizontal line has a slope of zero, and a straight up-and-down vertical line has an undefined slope.
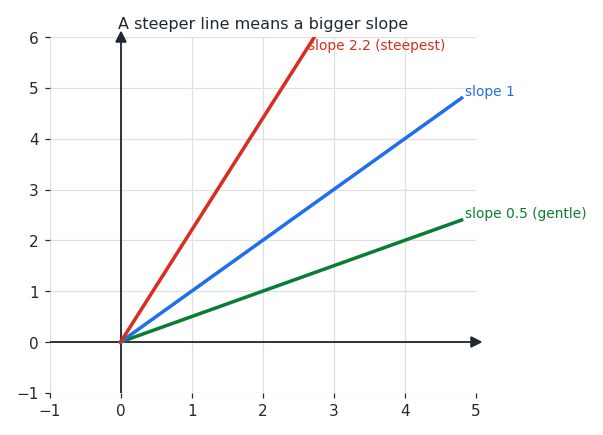
How steep a line looks tells you the size of its slope. A steeper line has a larger slope, meaning y changes faster for each step in x. So if one line climbs 4 units while another climbs only 1 unit over the same horizontal distance, the first has the bigger slope and the faster rate of change.
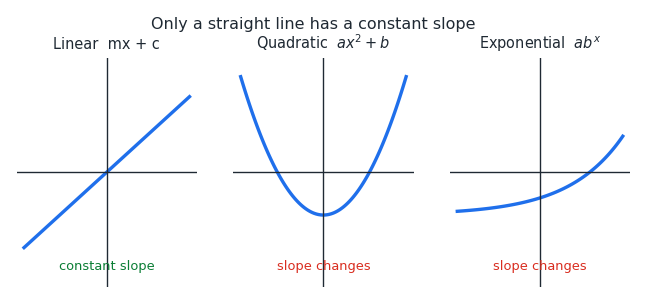
A straight line has the same slope everywhere — y changes by a fixed amount for each unit of x. A curve is different: its slope keeps changing, so y rises (or falls) faster in some places than others. For example, if a curve climbs from 20 to 30 over 4 years but from 30 to 40 in just 3 years, it is getting steeper, so its slope is not constant.
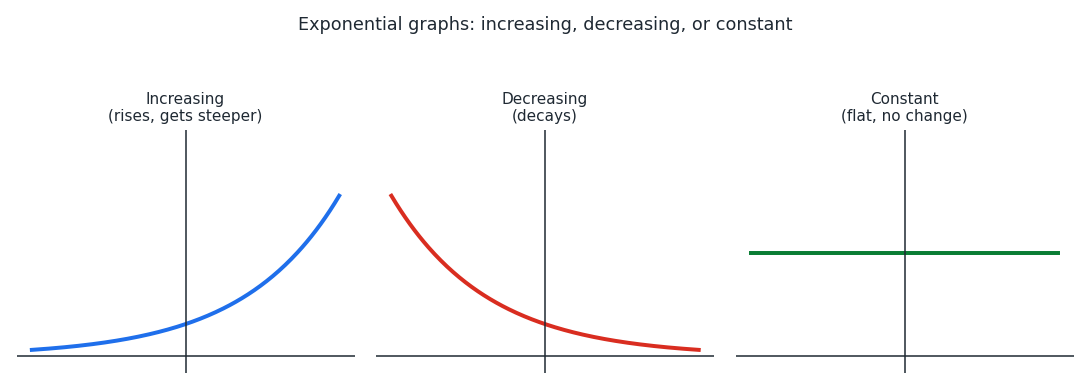
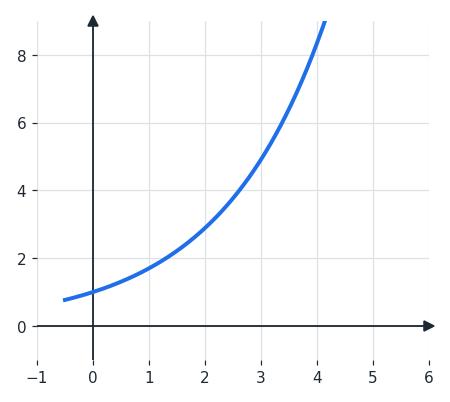
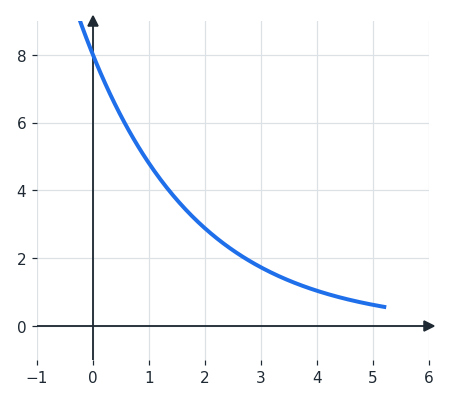
Looking at a graph as a whole, it can be increasing, decreasing, or constant. A common shape is the exponential curve: an increasing exponential climbs faster and faster, while a decreasing exponential (a decay) falls steeply at first and then levels off toward zero. To identify which, look at whether the curve goes up, down, or stays flat as you move to the right.
On a scatterplot, you look at the overall trend instead of a single line. If the points generally rise as you move right — say ice-cream sales climbing as the temperature goes up — the trend is increasing. If they generally fall, the trend is decreasing.
Worked examples
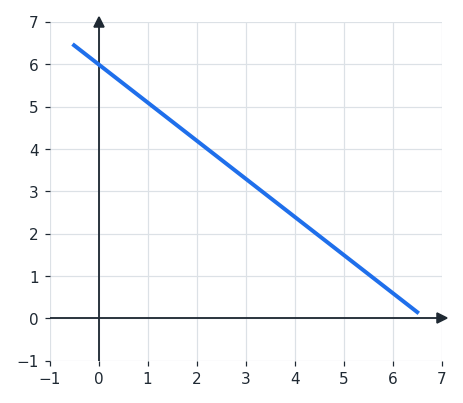
The graph below shows a straight line. Does it have a positive or a negative slope? As you move from left to right, the line goes downward, so y decreases as x increases. A line that falls from left to right has a negative slope.
The graph below shows a curve. Is it increasing or decreasing, and is its slope constant? The curve rises as you move to the right, so it is increasing. But it climbs faster and faster instead of by a fixed amount, so its slope is not constant — this is an increasing exponential curve.
The graph below shows a curve. Is its overall trend increasing or decreasing? The curve falls as you move to the right, dropping quickly at first and then leveling off toward zero. So the trend is decreasing — it is a decaying exponential curve.
Is this one of the topics costing you points?
Take the free 10-question diagnostic for a predicted SAT score and a breakdown of which domains are costing you points.