An SAT Math micro-topic under Nonlinear functions (Advanced Math). Free to read — no account needed.
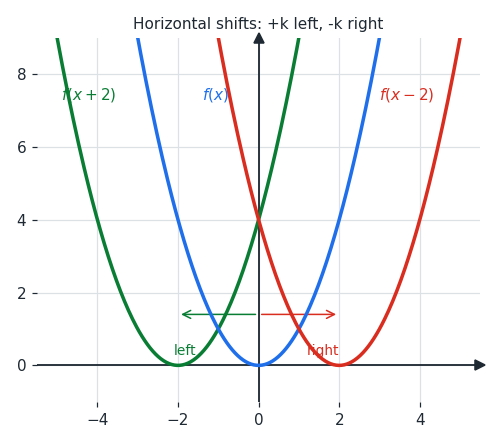
A horizontal shift slides the graph sideways while keeping its exact shape. Replacing x with x+k moves the graph left by k; replacing x with x−k moves it right by k. The sign works opposite to what you might expect.
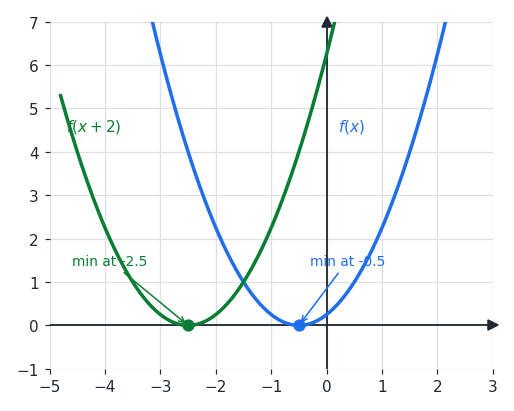
The figure shows a graph and its horizontal shifts. Replacing x with x+2 slides the curve 2 units left, while x−2 slides it 2 units right. The plus sign shifts left and the minus sign shifts right.
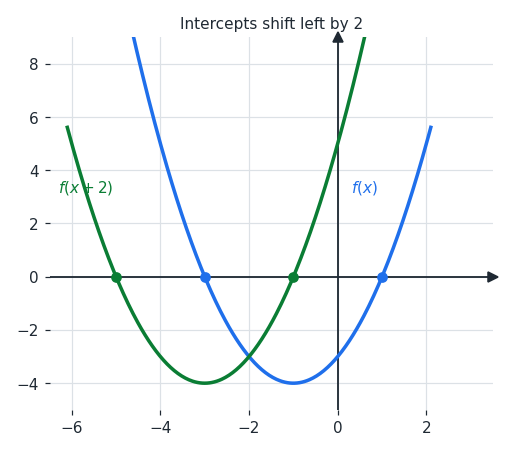
Every point moves by the same amount, so the vertex and the x-intercepts shift too. If a curve crosses the x-axis at −3 and 1, then f(x+2) crosses at −5 and −1. Each intercept moves 2 units to the left.
This works for any function, not just parabolas. Shiftingy=3x left by 4 units gives y=3x+4. You always replace x with x+k for a left shift.
Worked examples
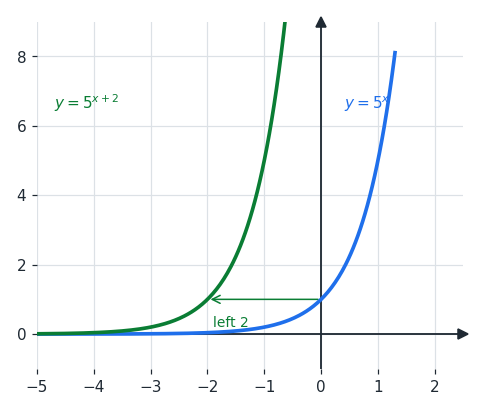
The graph of y=5x is shifted 2 units to the left. What is the new equation? Shifting left by 2 means replacing x with x+2. So the new equation is y=5x+2.
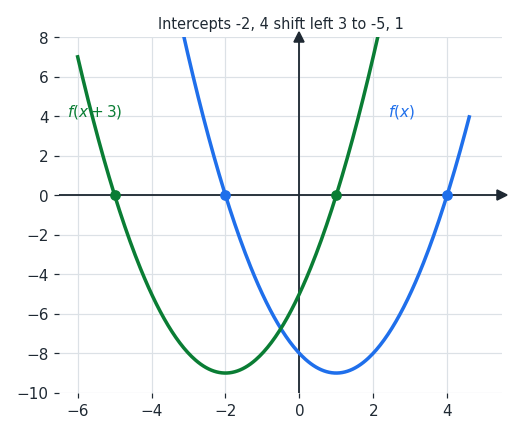
A curve crosses the x-axis at −2 and 4. Where does f(x+3) cross the x-axis? f(x+3) shifts the graph 3 units left, so each intercept moves 3 left. So the new x-intercepts are −5 and 1.
f(x) has its lowest point at x=−0.5. Where is the lowest point of f(x+2)? The lowest point of f happens when the input to f equals −0.5. For f(x+2), the input is x+2, so set x+2=−0.5. Solving gives x=−0.5−2=−2.5.
Is this one of the topics costing you points?
Take the free 10-question diagnostic for a predicted SAT score and a breakdown of which domains are costing you points.