Graphs of linear equations and functions
How the SAT tests this, with worked examples — plus the 4 skills it covers. Free to read, no account needed.
A linear graph is a straight line, and tells you everything about it: is the slope and the -intercept.
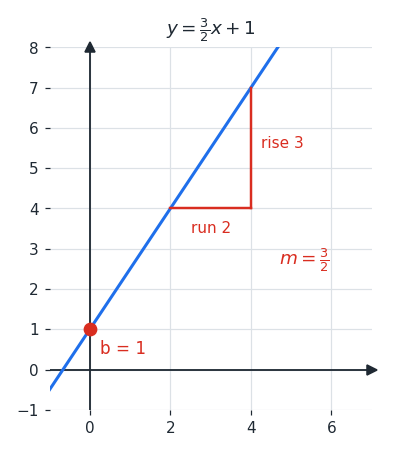
The slope is rise over run — how far the line climbs for each step right
A positive slope rises left to right, a negative slope falls, and a slope of zero gives a horizontal line. A vertical line has no defined slope at all, because the run is zero.
The y-intercept is where the line crosses the -axis, which is the value of when . The -intercept is the mirror image: set and solve.
Two facts about pairs of lines are tested constantly. Parallel lines have equal slopes. Perpendicular lines have slopes whose product is , so a line perpendicular to one with slope has slope .
Many questions never ask you to draw anything. They give two points and ask for the equation, or give an equation and ask what the slope means in context — in which case the slope is always a rate, something per something.
Worked examples
Find the slope of the line through and .
Apply the formula directly
Apply the formula directly
A line has slope and passes through . Write its equation.
The point is the -intercept, so and
The point is the -intercept, so and
Which line is perpendicular to ?
- A
- B{y = -
fracx + 2}
Perpendicular slopes multiply to , and {4
times -
frac = -1}, so (B) is correct. (A) is parallel, not perpendicular.
Perpendicular slopes multiply to , and {4
times -
frac = -1}, so (B) is correct. (A) is parallel, not perpendicular.
Is graphs of linear equations and functions costing you points?
Take the free 10-question diagnostic for a predicted SAT score and a breakdown of which domains are costing you points.