Polynomial and other nonlinear graphs
How the SAT tests this, with worked examples — plus the 5 skills it covers. Free to read, no account needed.
These questions ask you to match an equation to a picture. Two features settle almost every one: where the graph crosses the -axis, and what it does at the far left and far right.
End behaviour depends only on the degree and the sign of the leading coefficient.
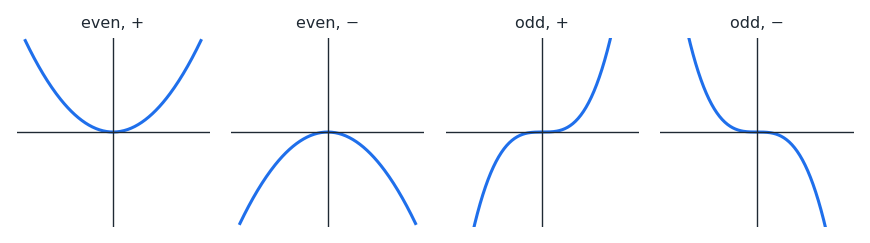
An even degree sends both ends the same way — both up when the leading coefficient is positive, both down when negative. An odd degree sends them opposite ways.
So before touching the algebra, look at the two ends of the pictured graph. That alone usually eliminates half the choices.
Then check the roots. A graph crossing at must come from an expression containing . If the graph touches the axis and turns back without crossing, that root is repeated — a squared factor.
A rational function adds asymptotes: the graph is undefined where the denominator is zero, which shows as a vertical line the curve races along but never touches.
Worked examples
A graph falls on the left and rises on the right. What can be said about its equation?
Opposite ends mean an odd degree, and rising on the right means a positive leading coefficient.
Opposite ends mean an odd degree, and rising on the right means a positive leading coefficient.
A graph touches the -axis at and turns back without crossing.
Which factor does it contain?
- A
- B
Touching and turning signals a repeated root, so (B) is correct. A single factor would cross straight through.
Is polynomial and other nonlinear graphs costing you points?
Take the free 10-question diagnostic for a predicted SAT score and a breakdown of which domains are costing you points.