Scatterplots
How the SAT tests this, with worked examples — plus the 4 skills it covers. Free to read, no account needed.
A scatterplot shows one dot per observation, and the SAT asks you to read it rather than build it. The line of best fit summarises the trend.
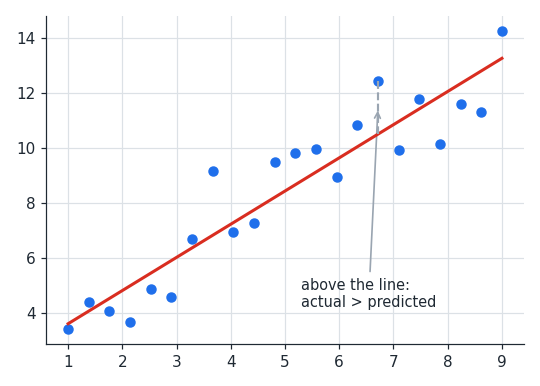
Three skills cover nearly every question. The first is predicting: read the line, not the dots, at a given . The second is interpreting slope and intercept in context — the slope is the change in per unit of , the intercept the predicted when .
The third is comparing an actual value with the predicted one. A point above the line means the real value exceeded the prediction; below means it fell short. Questions often ask by how much, which is just the vertical gap.
Two cautions appear repeatedly. A trend that holds across the plotted range may not hold outside it, so predictions far beyond the data are unreliable. And a relationship between two variables does not show that one causes the other.
Worked examples
A line of best fit is . Predict when .
Use the line, not any nearby dot
Use the line, not any nearby dot
For relating study hours to score, what does mean?
- AA student who studies no hours scores 1.4.
- BEach extra hour of study predicts 1.4 more points.
The slope is a rate of change per unit, so (B) is correct. (A) describes the intercept.
At the line predicts and the actual point is at .
How does the actual compare?
The point lies above the line, so the actual value exceeds the prediction by .
How does the actual compare?
The point lies above the line, so the actual value exceeds the prediction by .
Is scatterplots costing you points?
Take the free 10-question diagnostic for a predicted SAT score and a breakdown of which domains are costing you points.