An SAT Math micro-topic under Center, spread, and shape of distributions (Problem solving and data analysis). Free to read — no account needed.
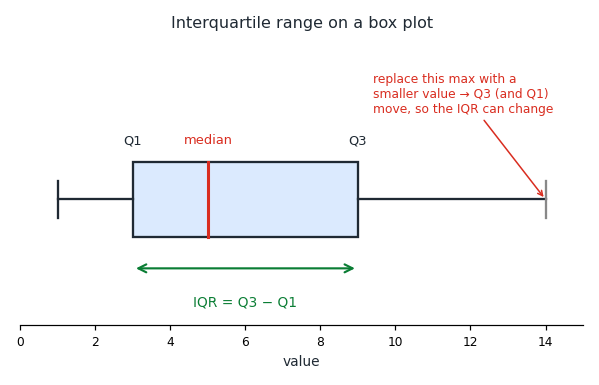
The interquartile range measures the spread of the middle half of a dataset: IQR=Q3−Q1. On a box plot it is the width of the box, from the first quartile to the third.
When you add or replace a value, the quartiles can shift. Suppose a new data point replaces the highest value in the set; the median, Q1, and Q3 may all move to new positions. Where exactly they land depends on the other values in the data.
The important point is that Q1 and Q3 need not move by the same amount. Q1 might rise by 1 while Q3 rises by 5, because each quartile is set by a different part of the data. Since the two ends move differently, the gap between them — the IQR — changes.
So never assume a change leaves the IQR fixed; check both quartiles. Find Q1 and Q3 before and after the change, then compare Q3−Q1. Only if both quartiles shift by the same amount, or neither moves, does the IQR stay the same.
Worked examples
A dataset has Q1=3 and Q3=9. What is its interquartile range? The IQR is Q3−Q1. So the IQR is 9−3=6.
After a new value is added, Q1 rises from 3 to 4 but Q3 stays at 9. Does the IQR change? The new IQR is 9−4=5, compared with the old 9−3=6. So yes, the IQR changes, dropping from 6 to 5.
A change shifts both Q1 and Q3 up by exactly 2. Does the IQR change? If both quartiles move by the same amount, their difference is unchanged. So the IQR stays the same.
Is this one of the topics costing you points?
Take the free 10-question diagnostic for a predicted SAT score and a breakdown of which domains are costing you points.