An SAT Math micro-topic under Center, spread, and shape of distributions (Problem solving and data analysis). Free to read — no account needed.
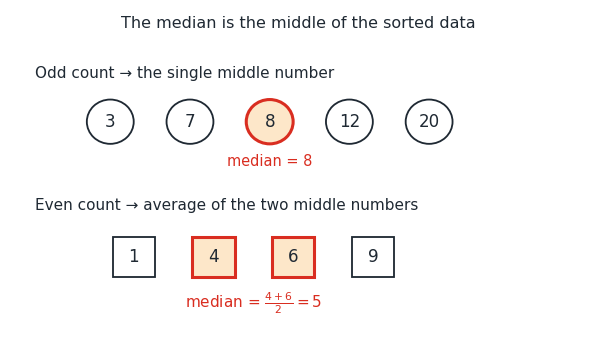
The median is the middle of a sorted data set — half the values fall below it and half above. The very first step is always to put the values in order.
When the count is odd, the median is the single middle value. You can find its position with 2n+1: for 13 values, that is the 7th value once sorted.
When the count is even, there are two middle values, and the median is their average. For the sorted set 1,4,6,9, the two middle values are 4 and 6, so the median is 24+6=5.
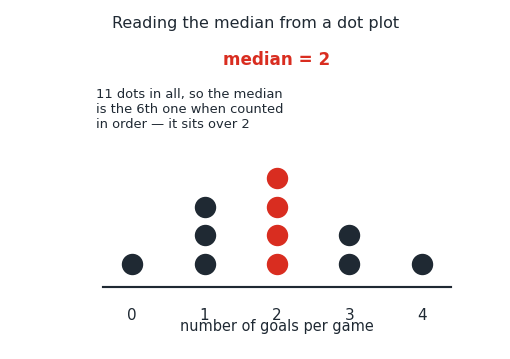
You can also read the median off a dot plot or frequency table without listing every value. First add up all the dots to get the total, then count in from the left until you reach the middle position. In the plot below there are 11 dots, so the median is the 6th one; counting from the left, the 6th dot sits over 2, so the median is 2.
Worked examples
What is the median of the set 3,8,12,20? There are four values (an even count), so the median is the average of the two middle ones, 8 and 12. So the median is 28+12=10.
A sorted data set has 13 values. Which value is the median? With an odd count, the median is at position 2n+1=213+1=7. So the 7th value is the median.
What is the median of the set 20,3,8,12,7? First sort the values: 3,7,8,12,20. With five values, the median is the single middle one, so the median is 8.
Is this one of the topics costing you points?
Take the free 10-question diagnostic for a predicted SAT score and a breakdown of which domains are costing you points.