An SAT Math micro-topic under Center, spread, and shape of distributions (Problem solving and data analysis). Free to read — no account needed.
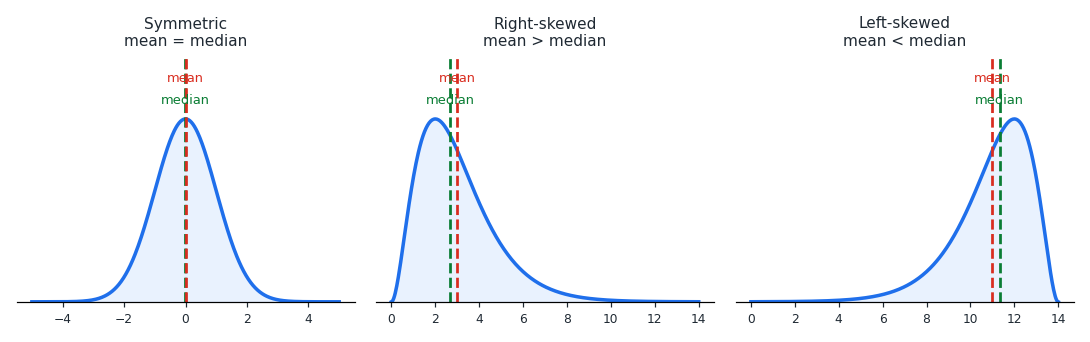
The distribution of a data set describes how its values are spread out. A symmetric distribution has left and right halves that mirror each other. In that case the mean and median are equal, sitting right in the center.
A distribution is skewed when one side has a long tail. In a right-skewed (positively skewed) distribution, a few unusually large values stretch the tail to the right. Those large values pull the mean up, so the mean ends up greater than the median.
A left-skewed (negatively skewed) distribution is the mirror image. A few unusually small values stretch the tail to the left and pull the mean down. So the mean ends up less than the median.
This gives a quick test. Compare the mean and the median: if the mean is bigger, the data is right-skewed; if the median is bigger, it is left-skewed; if they are equal, it is symmetric.
The reason this works is that the mean is sensitive to extreme values, while the median is not. One very large or very small value can shift the mean a lot but barely moves the median. That is why the median is often a better measure of the center for skewed data.
Worked examples
A data set has a mean of 65 and a median of 65. What does this suggest about its shape? When the mean and median are equal, the data is balanced around the center. So the distribution is symmetric.
A data set has a mean of 90 and a median of 78. Is it left-skewed or right-skewed? The mean is greater than the median, so a few large values are pulling the mean up. This means the distribution is right-skewed.
A town's household income has a mean of $75,000 and a median of $60,000. Which measure is being pulled by a few very wealthy households? The mean is much higher than the median, so the extreme high incomes are pulling the mean up. The median stays closer to the center, so it better represents a typical household.
Is this one of the topics costing you points?
Take the free 10-question diagnostic for a predicted SAT score and a breakdown of which domains are costing you points.