Center, spread, and shape of distributions
How the SAT tests this, with worked examples — plus the 9 skills it covers. Free to read, no account needed.
Every question in this area is really asking one of two things: where is the data centred, or how spread out is it. Centre is measured by the mean or the median. Spread is measured by the range, the interquartile range, or the standard deviation.
The single most common SAT trap is assuming that two data sets with the same mean must look alike. They need not. Both sets below have a mean of , but the second is far more spread out, so it has a much larger standard deviation.
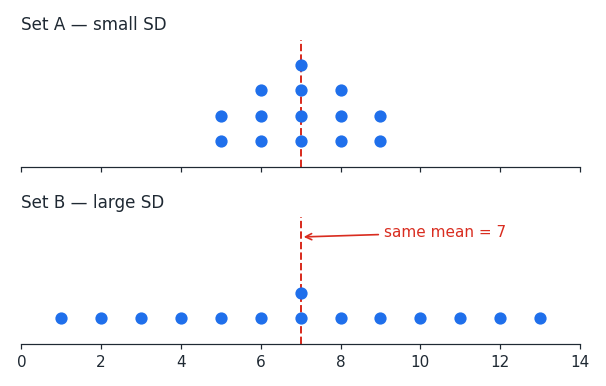
Standard deviation measures the typical distance of a value from the mean. You will almost never have to calculate it on the SAT. You will be asked to compare it between two sets, and the answer is always whichever set is more tightly clustered.
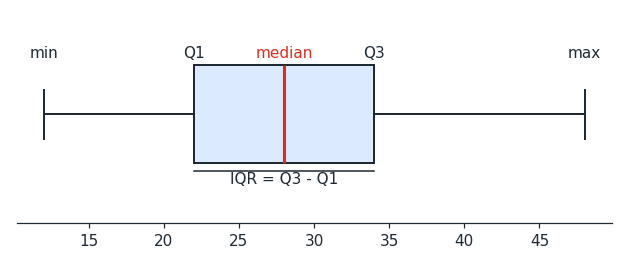
The median is the middle value once the data is ordered, and the interquartile range is the width of the middle half: . Both ignore extreme values entirely, which is exactly why the SAT reaches for them when a data set contains an outlier.
The shape of a distribution tells you how mean and median relate. In a symmetric distribution they are equal. A long tail drags the mean toward it, while the median barely moves.
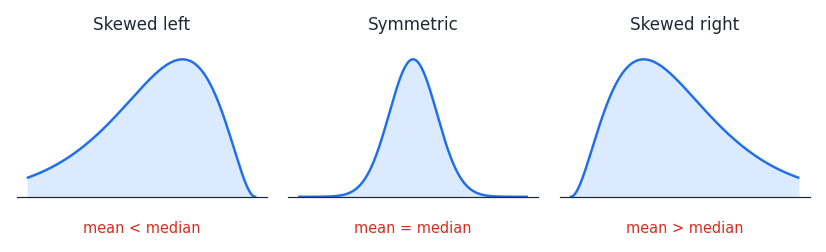
So if a question adds one very large value to a data set, the mean rises noticeably and the median shifts by at most one position. That asymmetry is the whole point of most questions here.
Worked examples
Two classes both average on a test. Class A scores range from to ; Class B from to .
Which class has the larger standard deviation?
- AClass A
- BClass B
Both have the same mean, so the mean tells you nothing here. Class B's scores sit much further from , so its typical distance from the mean is larger, making (B) correct.
A data set is . The value is added.
What happens to the mean and the median?
- ABoth increase a lot
- BThe mean increases a lot; the median increases slightly
The original mean is and the new mean is {
frac = 12.67}, a jump of nearly . The median moves only from to . So (B) is correct: one extreme value pulls the mean hard and the median barely at all.
frac = 12.67}, a jump of nearly . The median moves only from to . So (B) is correct: one extreme value pulls the mean hard and the median barely at all.
A box plot has and .
What is the interquartile range, and what does it tell you?
Apply the definition directly
What is the interquartile range, and what does it tell you?
Apply the definition directly
The middle half of the data spans units. Because the IQR uses only the quartiles, adding a single huge value at the top would leave it unchanged.
Is center, spread, and shape of distributions costing you points?
Take the free 10-question diagnostic for a predicted SAT score and a breakdown of which domains are costing you points.